SKYAI Bulls Stand at a Crossroads: Will They Break Through or Fall Back at This Pivotal Supply Zone?
Ever watched a rocket shoot up, only to come crashing back down so fast it makes your head spin? That’s exactly what happened with SKYAI between April and May—a staggering rally followed by an 84.68% retracement that could make even the boldest altcoin traders blink twice. Within weeks, most of that impressive surge vanished, almost as if the market squeezed a bear’s tantrum into a blink. But here’s the kicker: despite this gut-wrenching pullback, the long-term trend hasn’t thrown in the towel; the price is still holding above key moving averages and nudging up against resistance, hinting at an underdog story far from over. So, what’s really going on beneath the surface? Is this just a pause before the next leap, or a warning sign masked by hopeful charts? Let’s unpack the twists and turns behind SKYAI’s wild ride and see if the bulls are ready to charge once more. LEARN MORE
In April and May, SKYAI’s rally has been a strong momentum play for altcoin traders. The subsequent 84.68% retracement from $0.866 to $0.132 was a hefty pullback.
Within a month, most of the rally had been wiped out, giving the impression of a full-blown bear market compressed into a matter of weeks.
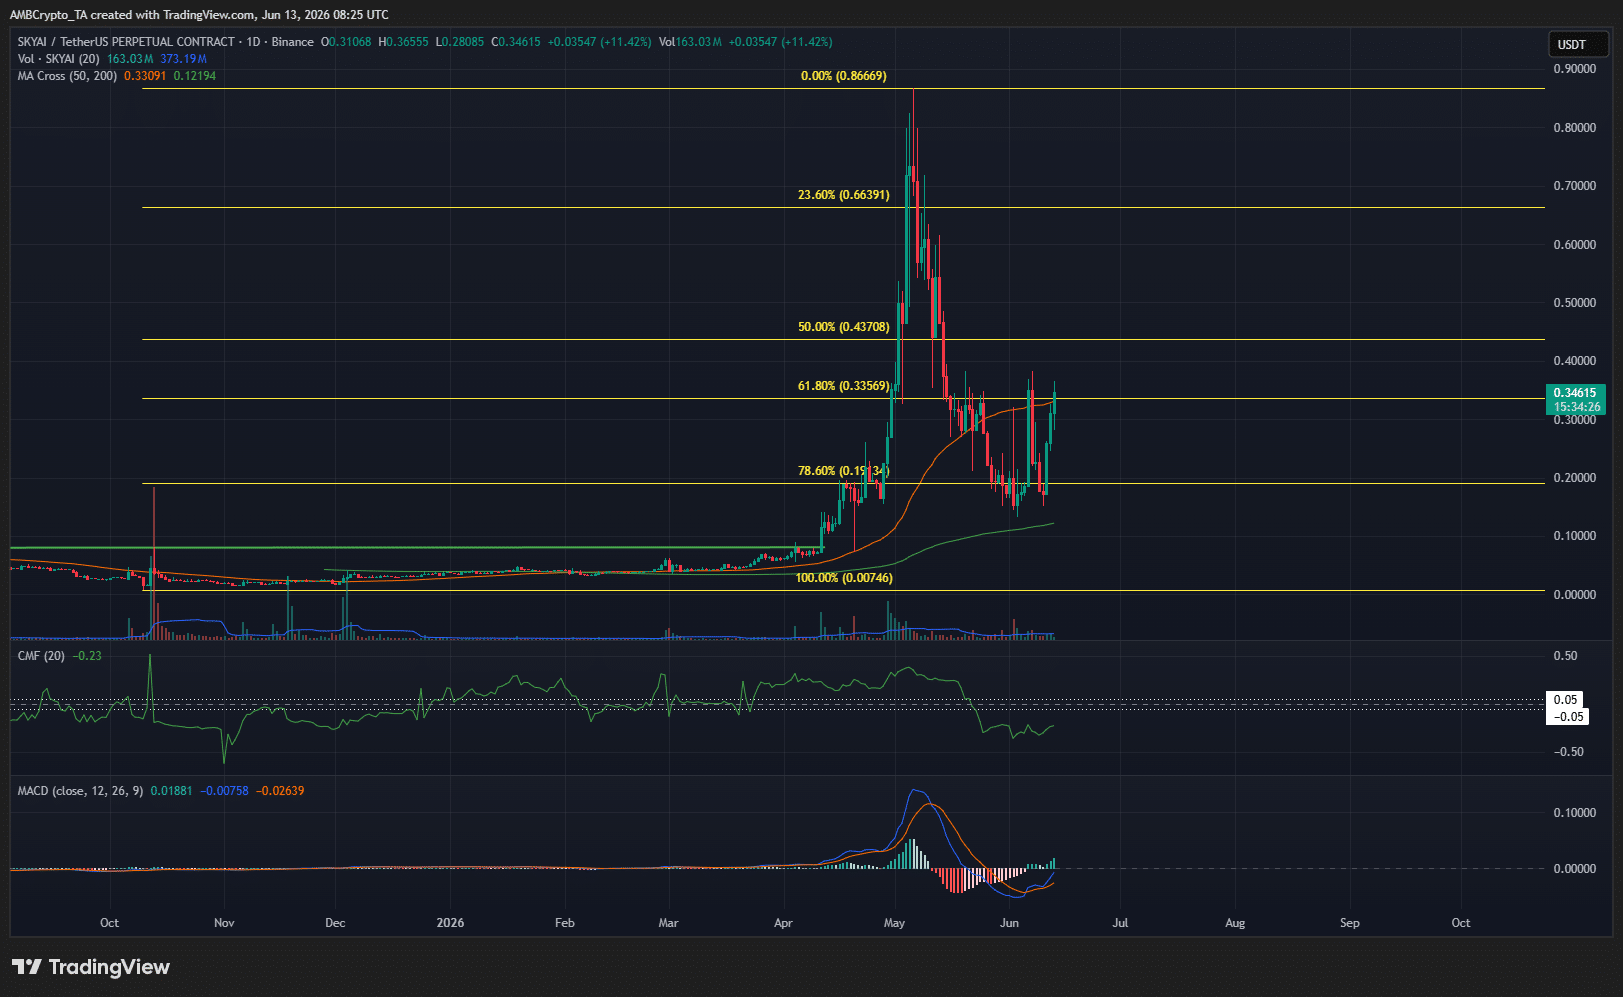
Yet, the SKYAI long-term trend remained bullish. The price was still trading above the 200-day moving average at $0.1219 and, at press time, was challenging the 50-day moving average at $0.3308.
In a recent report, AMBCrypto covered how short-term bullish strength vanished as the altcoin approached the $0.36 local resistance zone. An Open Interest flush was indeed met with another price decline toward the $0.15 support zone.
Accelerating profit-taking in the spot market also made a recovery difficult. Here’s a deep dive into the price action to understand what the next SKYAI trend could be.
Short-term consolidation belies longer-term SKYAI trend

Since the October crash forced a market bottom for the altcoin, it has steadily advanced higher. It finally beat the previous swing high at $0.08 (green) in April, and the bulls didn’t look back afterward.
From the 11th of April to the 6th of May, the token rallied by 1,102%. Despite the 84% retracement, its swing structure remains bullish. Even the 78.6% retracement level at $0.191 has been defended over the past two weeks.
The technical indicators reflected a bearish market state. For a month, the CMF has been well below -0.05 to indicate sizeable capital outflows. The MACD was also below the zero line at the time of writing.
Gauging the SKYAI breakout chances
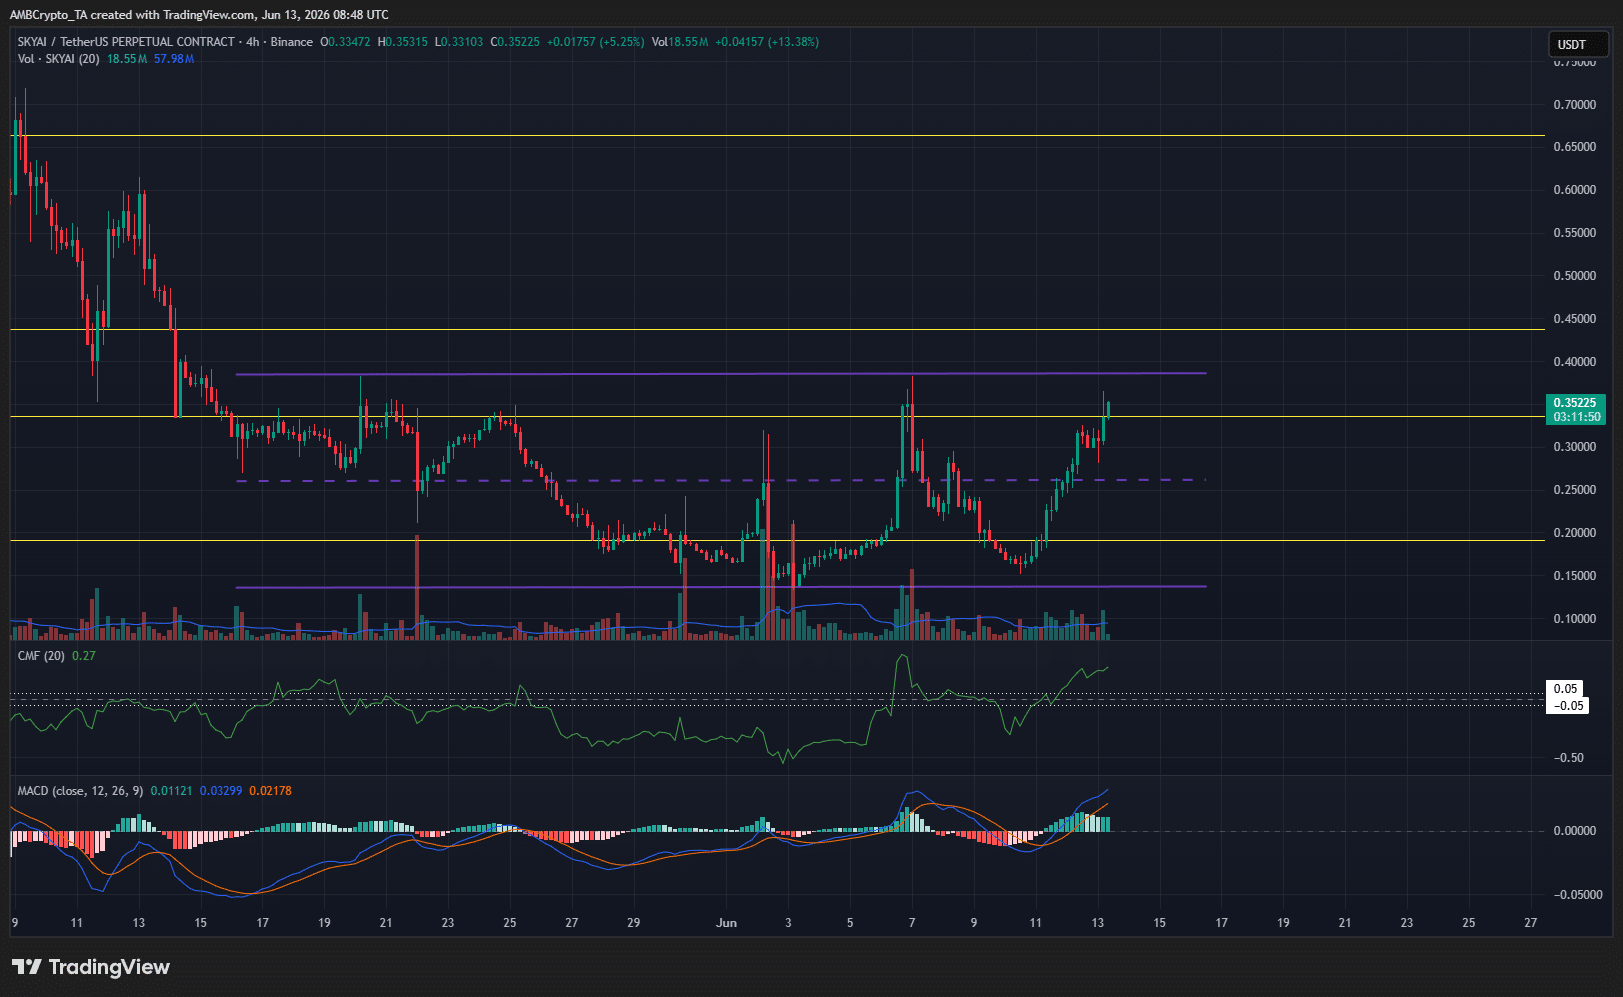
A range formation (purple) between $0.135 and $0.385 was in effect, as revealed by the 4-hour chart. At the time of writing, the token was advancing swiftly toward the highs.
The MACD and the CMF agreed on firm bullish momentum and sustained capital inflows. Therefore, a SKYAI bullish breakout past $0.385-$0.400 appeared likely.
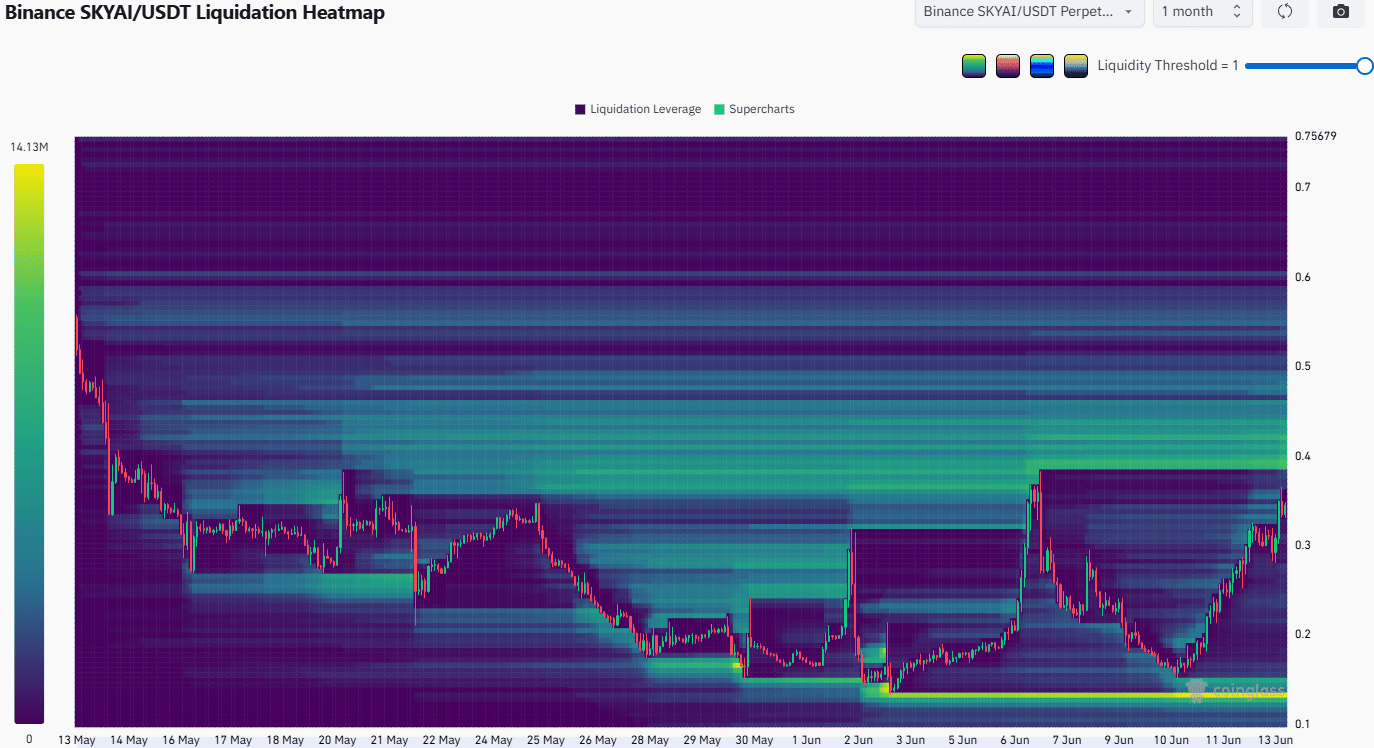
On the other hand, the liquidation heatmap outlined a large cluster of short liquidations from $0.39 to $0.44. It is possible that a bullish breakout into this magnetic zone would be met with rejection, which would catch out the buyers who entered the market following a range breakout.
It was a difficult scenario for SKYAI, but overall, a bullish bias remained warranted. Buyer caution around the $0.40 supply zone is necessary, but if this area is flipped to support over the next week, it could offer a feasible buying opportunity.
Final Summary
- The SKYAI profit-taking activity has not been enough to halt the latest price bounce back toward the range highs.
- The higher timeframe structure was bullish, but the $0.35-$0.40 supply zone posed a stern obstacle to the buyers.

Purina Pro Plan Veterinary Supplements Calming Care Dog Supplements - Supports Dogs with Everyday Stress, Anxious Behaviors, and Separation Anxiety - 30 ct. Box
(as of July 14, 2026 02:49 GMT +00:00 - More infoProduct prices and availability are accurate as of the date/time indicated and are subject to change. Any price and availability information displayed on [relevant Amazon Site(s), as applicable] at the time of purchase will apply to the purchase of this product.)
Greenies Pill Pockets for Dogs Large Size, Dog Treat Pouch for Capsule Medication, Peanut Butter Flavor, 15.8 oz. Pouch
(as of July 14, 2026 02:40 GMT +00:00 - More infoProduct prices and availability are accurate as of the date/time indicated and are subject to change. Any price and availability information displayed on [relevant Amazon Site(s), as applicable] at the time of purchase will apply to the purchase of this product.)
Oura Ring 5 Sizing Kit - Size Before You Buy Oura Ring 5 - Unique Sizing, Not Standard Ring Sizing - Receive Amazon Credit for Oura Ring 5 Purchase
(as of July 14, 2026 02:54 GMT +00:00 - More infoProduct prices and availability are accurate as of the date/time indicated and are subject to change. Any price and availability information displayed on [relevant Amazon Site(s), as applicable] at the time of purchase will apply to the purchase of this product.)
SHOKZ New OpenRun Pro 2- Bone Conduction Headphones, Open-Ear Bluetooth Wireless Sport Earphones for Running, Workouts - Sweat Resistant, Secure Comfortable Fit -Deep Bass, Smart Mic, Reflective Strip
(as of July 14, 2026 03:08 GMT +00:00 - More infoProduct prices and availability are accurate as of the date/time indicated and are subject to change. Any price and availability information displayed on [relevant Amazon Site(s), as applicable] at the time of purchase will apply to the purchase of this product.)


Post Comment