
ST Engineering’s 17% Drop: A Hidden Gem or a Risky Gamble at S$9.26?
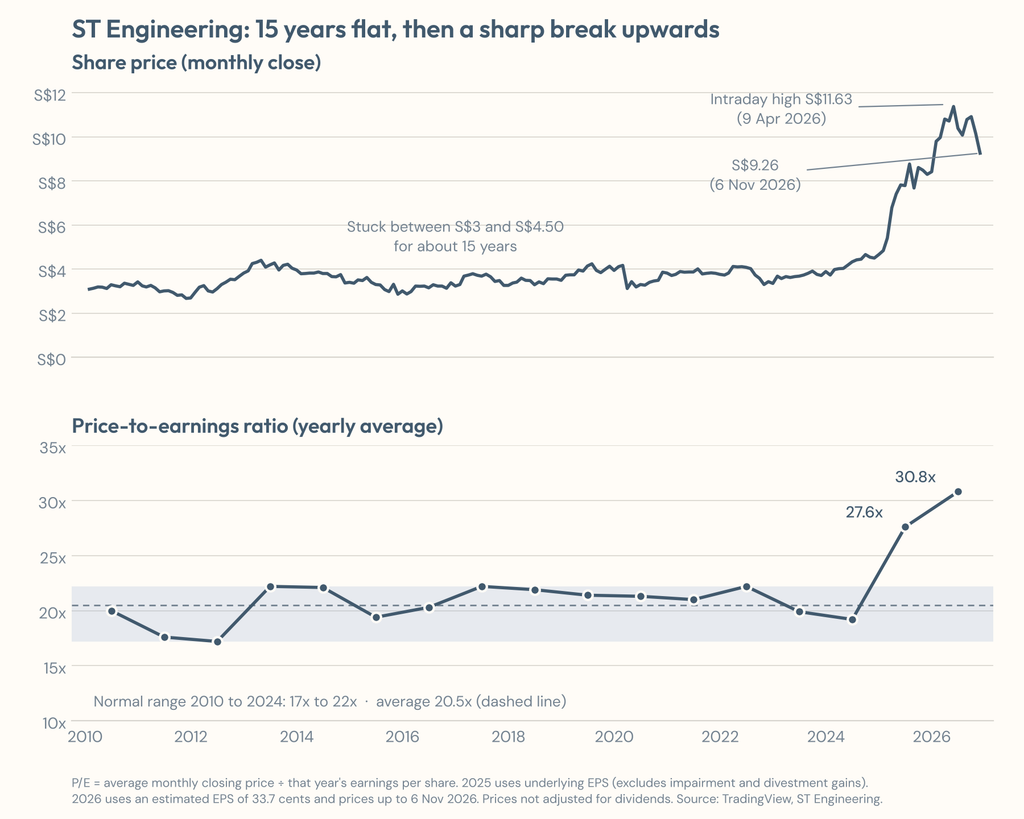
If you owned ST Engineering at the beginning of 2025, buckle up—you’ve been on quite the rollercoaster. The stock, once seen as a sleepy dividend darling, suddenly catapulted from S$4.66 to an all-time high of S$11.63 within just over a year. That’s a jaw-dropping 150% surge, followed by several months of sideways tread before a sharp plunge brought it back down to around S$9.26. It makes you wonder: How can a business fundamentally transform so rapidly that the market revalues it almost overnight? And more importantly—was this meteoric rise fueled by solid business fundamentals or just market hype riding a thrilling wave? To satisfy my curiosity, I dove headfirst into 16 years of financial data—unearthing the story beneath the numbers and what it truly means for investors today. Ready to discover whether ST Engineering’s past years of flattish growth gave way to genuine momentum, or if this recent surge is just a clever mirage? Let’s unpack the journey together. LEARN MORE
img#mv-trellis-img-1::before{padding-top:79.98046875%; }img#mv-trellis-img-1{display:block;}img#mv-trellis-img-2::before{padding-top:62.20703125%; }img#mv-trellis-img-2{display:block;}img#mv-trellis-img-3::before{padding-top:62.20703125%; }img#mv-trellis-img-3{display:block;}img#mv-trellis-img-4::before{padding-top:62.20703125%; }img#mv-trellis-img-4{display:block;}img#mv-trellis-img-5::before{padding-top:59.9609375%; }img#mv-trellis-img-5{display:block;}
If you owned ST Engineering at the start of 2025, the past two years have been quite a ride.
- The stock started 2025 at S$4.66. By the end of 2025, it closed at S$8.42. That’s an 81% gain in a single year, from a company most of us thought of as a steady dividend stock.
- Then 2026 started even better. By 8 April, the stock closed at S$11.47, and the next day it touched an all-time high of S$11.63.
After that, things went quiet.
From March to October, the stock mostly moved sideways between S$10 and S$11.50. Seven months of going nowhere. Then in early November, it dropped hard, closing at S$9.26 on 6 November.
From the end of 2024 to the peak, the stock went up about 150%. Even after the recent fall, it’s still up about 99%.
That got me curious.
- How much can a business really change in under two years for the market to reprice ST Engineering so significantly?
- And is a gain like this backed by the fundamentals, or is it mostly the market getting excited?
I went through 16 years of numbers to find out.
A dividend stock that the market suddenly sees differently
Most of us know ST Engineering as a dividend stock.
For a long time, it was the kind of company you bought, tucked away, and almost forgot about. You collected your 15 to 16 cents a year, and the share price stayed between S$3 and S$4.50 for the better part of 15 years.
I should know that since I been collecting the dividends from 2005 to 2018 during my time working there.
What I find most telling is how steady its valuation was.
The price-to-earnings ratio (P/E) is how many dollars you pay for every dollar of yearly profit the company earns. Here’s ST Engineering’s P/E for every year since 2010:
| Year | Average STE share price | Earnings per share | Average P/E |
|---|---|---|---|
| 2010 | S$3.22 | 16.1 cents | 20.0x |
| 2011 | S$3.04 | 17.2 cents | 17.6x |
| 2012 | S$3.22 | 18.7 cents | 17.2x |
| 2013 | S$4.14 | 18.7 cents | 22.2x |
| 2014 | S$3.76 | 17.0 cents | 22.1x |
| 2015 | S$3.30 | 17.0 cents | 19.4x |
| 2016 | S$3.16 | 15.6 cents | 20.3x |
| 2017 | S$3.56 | 16.1 cents | 22.2x |
| 2018 | S$3.45 | 15.8 cents | 21.9x |
| 2019 | S$3.94 | 18.4 cents | 21.4x |
| 2020 | S$3.55 | 16.6 cents | 21.3x |
| 2021 | S$3.83 | 18.2 cents | 21.0x |
| 2022 | S$3.78 | 17.1 cents | 22.2x |
| 2023 | S$3.72 | 18.7 cents | 19.9x |
| 2024 | S$4.29 | 22.4 cents | 19.2x |
| 2025 | S$7.53 | 27.3 cents (underlying) | 27.6x |
| 2026 so far | S$10.39 | 33.7 cents (my estimate) | 30.8x |
I can also tally the data in charts:

For 15 years, the P/E stayed in a narrow band of about 17 to 22 times. The average PE was 20.5 times.
It didn’t matter much what profits did. In some years they fell, in others they grew a little.
The P/E barely moved.
I think that’s because people valued it for the dividend, not for growth.
At around S$3.50 to S$4, a 15 to 16 cent dividend gave you roughly 4%. Whenever the price fell, the dividend yield looked attractive and buyers came in. Whenever it rose too much, the yield looked thin and they stopped buying. The dividend kept the price in its lane.
Then in 2025, it broke out of that range.
The P/E went to 27.6 times in 2025 and about 31 times on average in 2026. Today, at S$9.26, it’s around 27.5 times my estimate of 2026 earnings.
That’s well above anything we saw in the previous 15 years.
What a higher ST Engineering P/E is really telling you
A higher P/E is not automatically a bad thing. Some people feel cautious about a company trading at high P/E and would salivate a company when the P/E fell to lower than normal.
When the market pays a higher P/E, it’s usually saying it believes the business has become better. Maybe it will grow faster, or its profits are more reliable, or it will keep growing for longer.
Imagine two companies, each earning S$1 a share this year.
The first one earns about S$1 every year. Some years a bit more, some years a bit less. Ten years from now, it’s still earning around S$1.
The second one is growing. Next year it earns S$1.12, the year after S$1.25, and ten years from now, close to S$3.
Would you pay the same price for both? Probably not. You’d happily pay more for the second one, because you’re buying a bigger stream of future profits. That’s what a higher P/E is. You pay the same price for today’s earnings, but you’re also paying for tomorrow’s.
So when ST Engineering’s P/E moved from 20 times to the high 20s, the market was basically saying:
This is no longer the steady, slow company we knew. It’s becoming a growth company.
The question is whether that’s true, and for how long.
If the growth lasts a year or two and then fades back to the old pace, today’s P/E is too high and the price will likely come down. If ST Engineering can keep growing faster for many years, today’s P/E could turn out to be reasonable, or even cheap.
The P/E alone can’t tell us which one it is. It only tells us what the market believes.
To find out whether that belief holds up, we have to look under the hood at the business itself.
ST Engineering’s revenue grew for years. It’s profit didn’t follow until recently.
If the business really got better, the first thing I’d expect to see is faster growth.
Revenue is the total money customers pay the company. Profit is what’s left for shareholders after all the costs, interest and taxes. You want both to grow, but it’s profit that ends up paying your dividends and driving the share price over time.
When I lined up the two over 16 years, I saw three very different periods:
| Period | Revenue growth a year | Net profit growth a year |
|---|---|---|
| 2010 to 2018 | 1.4% | 0.1% |
| 2018 to 2023 | 8.6% | 3.5% |
| 2023 to 2026 (best estimate) | 10.4% | 21.5% |
2010 to 2018: Revenue and profits were just poor. Revenue went from S$5.98 billion to S$6.70 billion. Profit went from S$491 million to S$494 million. In eight years, profit grew by S$3 million. No wonder the market treated it like a bond.
2018 to 2023: Revenue picked up, but profit didn’t. This is the part I think a lot of investors would have missed.
Revenue grew 8.6% a year, helped by organic growth plus buying MRAS in 2019 and TransCore in 2022. By 2023, the company was selling 50% more than in 2018.
Yet profit only grew 3.5% a year.
The company was getting bigger, but it wasn’t keeping more of what it earned. All that extra revenue got eaten up somewhere along the way. I’ll explain where in the next section.
2023 to 2026: Profit finally stepped up. Profit grew about 21.5% a year, twice as fast as revenue. This is the growth the market got excited about, and it’s when the P/E broke out of its 15-year range.

From 2010 to 2023, revenue grew 69% while profit grew only 19%. You can observe the two lines drifted apart for years. Then from 2023, profit shot up and closed most of the gap.
Here’s what made me stop and think.
Over the full 16 years, revenue grew about 2.3 times and profit grew about 2.1 times. After all that excitement, profit has only just caught up with revenue.
So the big jump in profit over the past three years might not mean ST Engineering has become a fundamentally more profitable business.
A good part of it could be profit making up for lost time.
That matters a lot for the P/E.
If you look only at the last three years, you see a company growing profits at 20% a year, and a P/E of 27 or 30 times looks reasonable. If you believe part of that 20% was a one-time catch-up, then the real growth rate is closer to the 10% pace of revenue, and the same P/E looks a lot more expensive.
To find out which one is right, we need to understand why profit lagged for so long, and whether the things holding it back are truly gone.
Is ST Engineering, in its current form, a more profitable business than before?
If ST Engineering really has become a better business, I will expect it to keep more of every dollar it earns than it used to. That’s what profit margins tell us.
The easiest way to think about margins is to follow S$100 of revenue down to shareholders. Here’s what happened to every S$100 ST Engineering earned in the first half of 2026:
- S$19.50 left after the direct cost of doing the work, like materials, parts and labour on the job. This is the gross margin.
- S$15.00 left after running the company, like office staff, sales and R&D. This is the EBITDA margin. It’s the best measure of how profitable the day-to-day operations are.
- S$7.80 left for shareholders, after depreciation of equipment, amortisation of acquired businesses, interest on debt, tax and the share belonging to minority partners. This is the net margin.
Now compare that to the past:
| Period | Gross margin | EBITDA margin | Net margin |
|---|---|---|---|
| 2010 to 2013 | 21.8% | 12.8% | 8.7% |
| 2014 to 2019 | 20.2% | 13.5% | 7.7% |
| 2022 to 2023 | 19.0% | 14.8% | 5.8% |
| 2025 | 18.7% | 14.1% | 6.9% (underlying) |
| First half 2026 | 19.5% | 15.0% | 7.8% |
When I first looked at this, I had to read it twice. The three levels tell three different stories.
The gross margin is lower than before. ST Engineering keeps about 19.5 cents per dollar after direct costs, versus about 21 to 22 cents in the early 2010s. I think this is mainly the mix of work. Engine repair passes a lot of expensive parts through to customers at low markups, and big rail and tolling projects carry thinner margins.
The EBITDA margin is better than before. Operations now keep about 15 cents per dollar, versus about 13 cents in the 2010s. The company runs leaner. Overheads fell from 12.1% of revenue in 2022 to 10.2% in 2025. This is a real improvement and management deserves credit for it.
The net margin is only back to where it was. At 7.8%, shareholders keep about the same as in the late 2010s, and still less than the 8.7% of the early 2010s.
So how can the operations be more profitable while shareholders end up with the same, or less?
The answer is in the middle. Look at how much gets lost between EBITDA and net profit:

In 2010 to 2013, about 4 cents of every dollar disappeared between EBITDA and net profit. By 2022 and 2023, after buying TransCore, it was 8 to 9.5 cents.
That shaded area grew because of the acquisitions. When ST Engineering bought TransCore for US$2.68 billion with borrowed money, two things came with it:
- Interest. Total borrowings jumped from S$2.1 billion to S$6.5 billion in 2022. Every year, the interest on that debt comes out before shareholders get anything.
- Amortisation. When you buy a company for more than its assets are worth on paper, part of the price gets written off slowly over many years. It’s a non-cash cost, but it still reduces reported profit.
On top of that, the satellite communications business, bought over the years for about S$0.6 billion, kept losing money as players like Starlink changed the industry. In November 2025, ST Engineering wrote down S$667 million of its value and is now looking to sell it.
So the operations got better, but the cost of the acquisitions ate up all of that improvement and more.
Since 2023, that gap has been narrowing. Debt came down from S$6.5 billion to S$4.7 billion. Amortisation fell 22% in the first half of 2026. Satcom losses got smaller. The gap is now about 7 cents.
That’s where most of the recent profit jump came from. Profit is going up faster than revenue because less is being lost in the middle.
Here’s why this matters so much. ST Engineering will do around S$13.6 billion of revenue in 2026. Every 1 cent per dollar of net margin is worth about S$136 million of profit, which is about 13% of the total. A recovery from 5.8% to 7.8% adds roughly S$270 million, and that’s without selling a single extra contract.
So, is the business more profitable than before?
The operations are, a little. The shareholders’ share isn’t.
The bigger question is how much of this recovery is left. I don’t think the gap will go back to 4 cents. TransCore’s debt won’t fully disappear, and the amortisation runs for years. If the gap settles at around 6 to 7 cents, most of the margin catch-up has already happened.
And once the catch-up is done, profit can only grow about as fast as revenue, plus whatever extra efficiency management can find.
Are we paying a fair price for the growth?
What you pay for a stock matters. But so does what you get for it.
A P/E of 27 times can be expensive for one company and cheap for another. It depends on how fast the profits are growing. This is where the PEG ratio helps.
The PEG ratio takes the P/E and divides it by how fast earnings are growing. It asks a simple question: am I paying a fair price for the growth I’m getting?
Imagine two stocks, both with a P/E of 20.
The first one grows its profit 20% a year. Its PEG is 20 ÷ 20 = 1.
The second one grows its profit 5% a year. Its PEG is 20 ÷ 5 = 4.
Same P/E, but with the second one you pay four times as much for each unit of growth. That’s a lot of money for a slow business.
As a rough guide, here’s how I’d read the PEG:
- Below 1.4: cheap for the growth. You’re paying less than the growth rate. These are rare in good businesses.
- 1.4 to 2: fair. A reasonable price for a decent business that’s growing.
- Above 2: expensive for the growth. You’re paying a lot for each unit of growth. Either the market expects growth to speed up, or you’re paying for something other than growth.
This is just a rule of thumb so context is important. High-quality companies with very reliable earnings often trade above 2 for years.
Here’s ST Engineering’s PEG over time. For growth, I used how fast earnings per share grew each year over the previous three years.
| Year | Average P/E | Earnings growth a year (past 3 years) | PEG |
|---|---|---|---|
| 2010 | 20.0x | n/a | n/a |
| 2011 | 17.6x | n/a | n/a |
| 2012 | 17.2x | 8.3% | 2.1 |
| 2013 | 22.2x | 5.0% | 4.4 |
| 2014 | 22.1x | −0.4% | No growth |
| 2015 | 19.4x | −3.1% | No growth |
| 2016 | 20.3x | −5.8% | No growth |
| 2017 | 22.2x | −2.0% | No growth |
| 2018 | 21.9x | −2.6% | No growth |
| 2019 | 21.4x | 5.7% | 3.8 |
| 2020 | 21.3x | 1.2% | 17.8 |
| 2021 | 21.0x | 4.9% | 4.3 |
| 2022 | 22.2x | −2.5% | No growth |
| 2023 | 19.9x | 3.9% | 5.1 |
| 2024 | 19.2x | 7.1% | 2.7 |
| 2025 | 27.6x | 16.9% | 1.6 |
| 2026 so far | 30.8x | 21.7% | 1.4 |

If you went only by PEG, ST Engineering looked expensive for most of the last 15 years.
In most years the PEG was well above 2, sometimes 4 or 5. In 2020 it was almost 18. And in six of those years, there was no growth at all. You were paying 20 times earnings for a company whose profit had gone backwards over the previous three years.
So were investors overpaying all that time?
The investors were just weren’t paying for growth.
People bought ST Engineering because it was a steady, government-linked defence and engineering company that paid you about 4% a year, every year. It was closer to owning a bond than a growth stock. Nobody looked at their fixed deposit and complained that it wasn’t growing.
That’s why the P/E stayed at 20 times regardless of whether profit went up or down. The PEG was never the right way to value it.
Now look at 2025 and 2026.
For the first time, the PEG dropped into the fair range: 1.6 in 2025 and 1.4 in 2026. At today’s price of S$9.26, it’s about 1.3.
On this measure, ST Engineering has never looked cheaper. Even after the price nearly doubled, the growth seems to justify it.
But there’s a catch, and it goes back to the margins.
The 21.7% growth in that PEG includes the one-off margin recovery. Profit grew fast partly because the cost of the acquisitions was shrinking. That part can’t repeat.
If I use 11.5% growth, which I think is more sustainable, the PEG today is about 2.4. That puts it back in the expensive range, about where it sat for most of the 2010s.
A PEG is only as good as the growth number you put into it. Use the last three years and the stock looks cheap. Use what’s likely to come next and it looks fully priced.
Doubling of share price in about a year: how much was earned?
Let me be specific about the run.
At the end of 2024, ST Engineering closed at S$4.66. The first real push came on 27 February 2025, when it reported record revenue, profit and order book for 2024. Then European defence stocks surged in early March, and on 18 March management laid out its 2029 targets and a new dividend policy. The stock went from around S$5 to almost S$7 in three weeks.
It never really looked back.
On 14 January 2026, it closed at S$9.39, double the price at the end of 2024. That’s 100% in about a year, from a stock that had gone nowhere for 15 years. By 9 April 2026 it touched S$11.63, up 150% in just over 15 months.
So how much of that was the business, and how much was the market getting excited?
Here’s how I worked it out. You don’t need to be a finance person to follow it.
A share price is basically two things multiplied together:
Price = earnings per share × P/E
So a price can go up for only two reasons. The company earns more, or the market pays more for each dollar of earnings. To separate them, I asked one simple question:
What would the share price be today if the business had grown, but the market had kept paying the same P/E as before?
At the end of 2024:
- Earnings per share was 22.4 cents.
- The price was S$4.66.
- So the P/E was about 20.8 times.
Today:
- Earnings per share is about 33.7 cents (my 2026 estimate).
- The price is S$9.26.
- So the P/E is about 27.5 times.
If the market had kept paying 20.8 times, the price today would be 33.7 cents × 20.8 = S$7.01.
That means:
- From S$4.66 to S$7.01 (+S$2.35) came from earnings growth. This is the part the business earned.
- From S$7.01 to S$9.26 (+S$2.25) came from the higher P/E. This is the part that came from the market’s change in mood.
About half and half.
At the peak of S$11.63, the same maths gives S$2.35 from earnings and S$4.62 from the higher P/E. At the top, about one-third of the gain was the business and two-thirds was the market’s excitement.
(If you want to be more precise, the answer shifts a bit depending on where you start and which year’s earnings you use. Starting from mid-2024, or using a slightly different method, you get anywhere from 40% to 60% from earnings. Whichever way you cut it, roughly half the gain is earnings and half is a higher P/E.)
What does this mean from here?
The P/E going from about 20 times to 27 times is the market saying: “This is a better business now, and it deserves a higher price.” That re-rating has already happened. It’s already in the price you pay today.
From here, I don’t think you can count on the P/E going much higher. If anything, history says it’s more likely to drift down than up. So if you buy today, your return mostly depends on one thing:
Can ST Engineering keep growing its earnings, and for how long?
There are really two ways a company can justify a high P/E:
- The sprint. Earnings grow very fast for a few years, then slow down to a normal pace.
- The marathon. Earnings grow at a decent but not spectacular rate, and keep doing it for a long time.
Both can add up to the same value today. But they’re very different bets.
Three possible futures for ST Engineering
I worked out what ST Engineering would be worth today under three different futures. The valuation will be based on discounted cash flow(DCF).
Scenario 1: The new growth fades, and ST Engineering goes back to its old self
Say the past few years turn out to be a cycle, not a new normal. Growth falls back to the 2.5% a year we saw in the 2010s.
- If it fades soon (one more good year in 2027, then back to 2.5%): about S$6.40 a share, roughly 31% below today.
- If it fades after 2029 (management hits its targets, then back to 2.5%): about S$7.41 a share, roughly 20% below today.
This is the scenario I think investors should take seriously. ST Engineering grew this slowly for almost a decade, so it isn’t a far-fetched outcome. Even if management delivers everything it has promised up to 2029, the stock would be worth about 20% less than today if growth stalls after that.
Scenario 2: The new growth rate lasts a few more years
Say ST Engineering keeps growing profit at 12% a year for five years, to 2031, then settles into normal growth of 3% a year, roughly in line with the economy.
- Value: about S$9.42 a share, roughly the same as today’s price.
So today’s price is essentially paying for about five more years of strong growth.
Scenario 3: The new growth rate lasts 10 years
Say the defence cycle, engine repair demand and smart city projects keep ST Engineering growing at 12% a year all the way to 2036, then it settles at 3%.
- Value: about S$12.95 a share, roughly 40% above today.
This is the bull case. It needs a decade of strong growth from a company that, until recently, had a decade of almost none.

The chart shows all of this in one picture. Each bar is what the stock is worth depending on how many years the 12% growth lasts. Each extra year of strong growth adds about 50 to 75 cents to the value.
At S$9.26, the market is pricing in about 4.7 years of 12% growth. That’s roughly management’s 2029 plan, plus another year or two after it.
Depending on the growth rate and the return you want, it’s somewhere between 4 and 7 years:
| Growth rate during the strong years | If you want 6.5% a year | If you want 7% a year | If you want 7.5% a year |
|---|---|---|---|
| 10% | 2.9 years | 6.1 years | 9.5 years |
| 12% | 2.3 years | 4.7 years | 7.3 years |
| 13.5% (management’s target) | 2.0 years | 4.1 years | 6.2 years |
| 15% | 1.7 years | 3.6 years | 5.4 years |
At the peak of S$11.63, it was a different story. The market was pricing in about 8 years of 12% growth, roughly to 2034 or 2035. That’s well beyond anything management has guided for. In effect, investors were betting that ST Engineering would ride the whole European defence cycle at full speed.
We can also flip around by looking at if we are less demanding of return (6.5% a year) or more demanding (7.5% a year), what price are we okay to own.
| Scenario | Value at 6.5% | Value at 7% | Value at 7.5% |
|---|---|---|---|
| 1. Fades after 2027, back to 2.5% | S$7.43 | S$6.39 | S$5.55 |
| 1. Fades after 2029, back to 2.5% | S$8.66 | S$7.41 | S$6.42 |
| 2. 12% for 5 years, then 3% | S$11.22 | S$9.42 | S$8.03 |
| 3. 12% for 10 years, then 3% | S$15.61 | S$12.95 | S$10.91 |
The table seem to point that we are either expecting this profit growth to be longer, or that we are okay with a lower 6.5% per year return by paying the current price.
What about the dividends?
Most people bought ST Engineering for the dividend. So I wanted to see how that dividend has actually grown, and what it has been worth as a yield along the way.
Here’s the dividend for each financial year, compared with the share price on 1 June of that year. I picked 1 June because it’s roughly the middle of the year. The prevailing dividend yield is what you would have earned that year if you bought on that day.
| Financial year | Dividend (cents) | Change | STE Share price on 1 June | Prevailing dividend yield | Payout ratio |
|---|---|---|---|---|---|
| 2010 | 14.55 | S$3.11 | 4.7% | 90% | |
| 2011 | 15.50 | +6.5% | S$3.00 | 5.2% | 90% |
| 2012 | 16.80 | +8.4% | S$2.96 | 5.7% | 90% |
| 2013 | 15.00 | −10.7% | S$4.00 | 3.8% | 80% |
| 2014 | 15.00 | 0% | S$3.86 | 3.9% | 88% |
| 2015 | 15.00 | 0% | S$3.39 | 4.4% | 88% |
| 2016 | 15.00 | 0% | S$3.16 | 4.7% | 96% |
| 2017 | 15.00 | 0% | S$3.69 | 4.1% | 91% |
| 2018 | 15.00 | 0% | S$3.45 | 4.3% | 95% |
| 2019 | 15.00 | 0% | S$3.98 | 3.8% | 81% |
| 2020 | 15.00 | 0% | S$3.22 | 4.7% | 90% |
| 2021 | 15.00 | 0% | S$3.87 | 3.9% | 82% |
| 2022 | 16.00 | +6.7% | S$4.13 | 3.9% | 94% |
| 2023 | 16.00 | 0% | S$3.65 | 4.4% | 85% |
| 2024 | 17.00 | +6.2% | S$4.14 | 4.1% | 75% |
| 2025 | 18.00 | +5.9% | S$7.81 | 2.3% | 66% |
| 2026 (estimate) | about 20.5 | about +14% | S$11.16 | 1.8% | about 61% |
The payout ratio is the share of each year’s profit paid out as dividends. The 2010 to 2014 dividends include special dividends.
Over 15 years, from FY2010 to FY2025, the dividend grew from 14.55 cents to 18 cents. That’s about 1.4% a year.
If you include my estimate for 2026, it’s about 2.2% a year.
That’s slower than inflation for most of the period. I think it’s worth sitting with that for a moment. The stock many of us thought of as a reliable income stock barely raised its dividend for over a decade.
When I look closer, the dividend history falls into three periods:
- 2010 to 2012: rising. The dividend went from 14.55 to 16.8 cents, helped by special dividends on top of the ordinary ones.
- 2013 to 2021: frozen at 15 cents for nine years. In 2013 the company cut its payout ratio from 90% to 80%, and the dividend dropped. After that it stayed at exactly 15 cents every year, through good years and Covid alike.
- 2022 onwards: growing again. 16 cents, then 17, then 18. From 2021 to 2025, the dividend grew about 4.7% a year, and 2026 looks set for a bigger jump.
The prevailing dividend yield tells an even more interesting story.
From 2010 to 2024, the prevailing dividend yield was roughly 4 to 5% almost every year. That’s very steady, and I think that steadiness is exactly what held the share price in its S$3 to S$4.50 range. When the yield went above 5%, buyers came in. When it dropped near 3.5%, they stopped.
Then in 2025, the prevailing dividend yield fell to 2.3%. In 2026, it’s about 1.8%.
The dividend didn’t get cut. It actually grew. The share price just rose much faster than the dividend.
That’s the clearest sign that the people buying ST Engineering today are not dividend investors. Nobody buys a stock at 1.8% for income when a Singapore Savings Bond pays more. [Edit if you want to compare with the current SSB or T-bill rate.]
There’s one more thing in the table worth noticing: the payout ratio.
It used to be 80 to 95%. ST Engineering paid out almost everything it earned, which left little to reinvest and explains why the dividend couldn’t grow. Now it’s down to about 60 to 66%. The company is keeping more profit to fund growth, and the dividend grows more slowly than earnings.
That’s by design. Under the new policy from 2025, ST Engineering pays out about one-third of each year’s increase in net profit as extra dividends.
Here’s what that means in practice. Say profit grows 13.5% next year, in line with management’s 2029 target. Earnings per share would go up by about 3.7 cents. One-third of that is about 1.2 cents, so the dividend would rise from about 20.5 cents to about 21.7 cents. That’s a dividend growth of about 6%, roughly half the speed of profit growth.
So the dividend will likely keep growing, and faster than it did in the 2010s. But if you buy at today’s prices, it will take a long time before the dividend alone gives you a yield like the old 4%.
At S$9.26 and 20.5 cents, you start at about 2.2%. Even if the dividend grows 6% a year, you’d need about 11 to 12 years for the yield on your purchase price to reach 4%.
So, what are you really buying at S$9.26?
I think I’ll leave the final call to you. But here’s how I’d sum up what I found.
Part of the climb was earned, and part was market giving ST Engineering a better valuation. From the end of 2024, about half of the gain came from real earnings growth. The other half came from the market deciding ST Engineering deserved a P/E of 27 instead of 20.
I wouldn’t count on the P/E going higher. For 15 years, this stock traded at about 20 times earnings. The re-rating to the high 20s has already happened. From here, you’d better hope it isn’t a P/E contraction. If the market loses faith and goes back to paying 20 times, even good earnings growth would struggle to lift the share price.
The earnings part is priced for 4 to 7 more years of strong growth. At S$9.26, the market expects ST Engineering to keep growing profit about 12% a year until roughly 2031 before tapering off. Some of that is backed by a big order book and management’s 2029 targets. The years after that are a bet on the defence cycle, engine repair demand and smart city projects lasting into the next decade.
Do you agree that it can keep that up? That’s for you to decide.
But here’s the part I think is worth sitting with, even if you do agree.
All the values in my scenarios use a 7% required return. That means if ST Engineering does exactly what today’s price expects, growing about 12% a year for about five years, you would earn about 7% a year from here, including dividends. In investor terms, your XIRR would be around 7% a year.
That’s a decent return. But it’s a long way from the 100% in a year that recent shareholders enjoyed.
To do much better than 7%, you need the growth to last longer than five years, or the market to pay an even higher P/E. To do worse, the growth only needs to fade a bit earlier, or the P/E only needs to slip back toward its old average of 20 times.
So if you’re looking at ST Engineering today because of how well it has done, I think it’s worth moderating your expectations. The business has genuinely become better. But a good business and a good investment are not always the same thing. It depends on the price you pay.

Kyith is the Owner and Sole Writer behind Investment Moats. Readers tune in to Investment Moats to learn and build stronger, firmer wealth foundations, how to have a Passive investment strategy, know more about investing in REITs and the nuts and bolts of Active Investing.
Readers also follow Kyith to learn how to plan well for Financial Security and Financial Independence.
Kyith worked as an IT operations engineer from 2004 to 2019. Currently, he works as a Senior Solutions Specialist in Fee-only Wealth Advisory Firm Providend. All opinions on Investment Moats are his own and does not represent the views of Providend.
You can view Kyith’s current portfolio here, which uses his Free Google Stock Portfolio Tracker.
His investment broker of choice is Interactive Brokers, which allows him to invest in securities from different exchanges all over the world, at very low commission rates, without custodian fees, near spot currency rates.
You can read more about Kyith here.

Core Power Fairlife 26g Protein Milk Shakes, Liquid Ready To Drink for Workout Recovery, Chocolate, 14 Fl Oz Bottle (Pack of 12)
$41.88 (as of November 8, 2026 03:22 GMT +00:00 - More infoProduct prices and availability are accurate as of the date/time indicated and are subject to change. Any price and availability information displayed on [relevant Amazon Site(s), as applicable] at the time of purchase will apply to the purchase of this product.)
Active Noise Cancelling Ear Buds Wireless Bluetooth Headphones 80H Playtime Display Charging Case 50dB ANC Over Ear Hooks Earbuds with Hi-Res Sound & Clear Calls for Sports Running Gym Workout Black
$89.99 (as of November 8, 2026 03:36 GMT +00:00 - More infoProduct prices and availability are accurate as of the date/time indicated and are subject to change. Any price and availability information displayed on [relevant Amazon Site(s), as applicable] at the time of purchase will apply to the purchase of this product.)
Amazon Basics Leak-Proof Dog and Puppy Potty Training Pee Pads with Quick-Dry 5-Layer Super Absorbent Design, Regular Size 22 x 22 inch, Blue & White, 100 Count
$20.99 (as of November 8, 2026 03:22 GMT +00:00 - More infoProduct prices and availability are accurate as of the date/time indicated and are subject to change. Any price and availability information displayed on [relevant Amazon Site(s), as applicable] at the time of purchase will apply to the purchase of this product.)
Milk-Bone Soft & Chewy Dog Treats, 25 Oz. Canister | Made with real beef & filet mignon, tender dog treats, easy to chew, for dogs of all ages and sizes
$14.48 (as of November 8, 2026 03:22 GMT +00:00 - More infoProduct prices and availability are accurate as of the date/time indicated and are subject to change. Any price and availability information displayed on [relevant Amazon Site(s), as applicable] at the time of purchase will apply to the purchase of this product.)










Post Comment