The Shocking Truth Behind Why Banks Are Quietly Printing Money—Even Without Rate Cuts Revealed!
Ever caught yourself thinking, “If interest rates climb, then surely banks—especially the smaller ones—are toast”? It’s a common tale swirling around the financial grapevine. But here’s the kicker: what if that narrative?—?the one we cling to like a security blanket—is actually missing the bigger picture? Investors often jump to simple cause-and-effect conclusions: if rates rise, then banks suffer; if rates fall, profits bloom. Yet, the market’s reality is messier, more intricate. For those of us betting on long-term strategies rather than quick flips, understanding these nuances could be the difference between missing opportunities and riding the wave. So, what really happens to smaller banks when interest rates refuse to fall? And why might “higher for longer” interest rates not just be a curse but, surprisingly, a blessing in disguise? Let’s dive into the unfolding tale of regional banks, yield curves, and market expectations that defy the usual script. LEARN MORE
img#mv-trellis-img-1::before{padding-top:69.43359375%; }img#mv-trellis-img-1{display:block;}img#mv-trellis-img-2::before{padding-top:37.5%; }img#mv-trellis-img-2{display:block;}img#mv-trellis-img-3::before{padding-top:39.94140625%; }img#mv-trellis-img-3{display:block;}img#mv-trellis-img-4::before{padding-top:69.43359375%; }img#mv-trellis-img-4{display:block;}img#mv-trellis-img-5::before{padding-top:69.43359375%; }img#mv-trellis-img-5{display:block;}img#mv-trellis-img-6::before{padding-top:69.43359375%; }img#mv-trellis-img-6{display:block;}img#mv-trellis-img-7::before{padding-top:69.43359375%; }img#mv-trellis-img-7{display:block;}img#mv-trellis-img-8::before{padding-top:24.043715846995%; }img#mv-trellis-img-8{display:block;}
I wanted to note down some market observations that can be fleeting. If I do not, then it will be a chore to revisit and gather them again. You can read if you wish to.
Many of us think that if interest rate goes up, then interest rate sensitive securities or sectors won’t do well. If USD goes down, then emerging markets, international securities don’t do well. When markets panic, they will automatically fly to USD and JPY.
And they make their investment decision based on this belief of => If A happens, then B happens, causing C to happen,. Based on that then I should or should not invest in something.
If you are a trader or being very, very tactical, which means your time frame to make this work is a few months, then these things matter.
When an investor running a strategic portfolio, with a long term time frame reads these things, and think that the author is talking in their timeframe, then it becomes poisonous because they act on it. Acting on it might be not buying at all.
Most importantly, market is more complex and many failed to have the humility to understand that and factor that into their system. What affects the ultimate price is not just one single, or two factors a whole host of them and you got to admit that you cannot always be sure.
Perhaps only in hindsight.
If Interest Rates Fail to Come Down, it Does Not Bode Well for Smaller Banks
This is something that I been hearing so much on social media.
If interest rates are lowered, the rate they paid on deposits can be lower and if the bank can still loan out (typically at longer maturity interest rates) at relatively high rates, then this will vastly improve their profits. Smaller banks are more sensitive because this traditional savings and loans function is a significant part of their business.
Not just that, in order for loan books to look healthy or thrive, lower interest rates help those business that may be struggling to borrow.
But if interest rates fail to come down, or even go up, would that screw banks up?
That is what this data piece is trying to do.
Let’s start off with where we currently at right now.
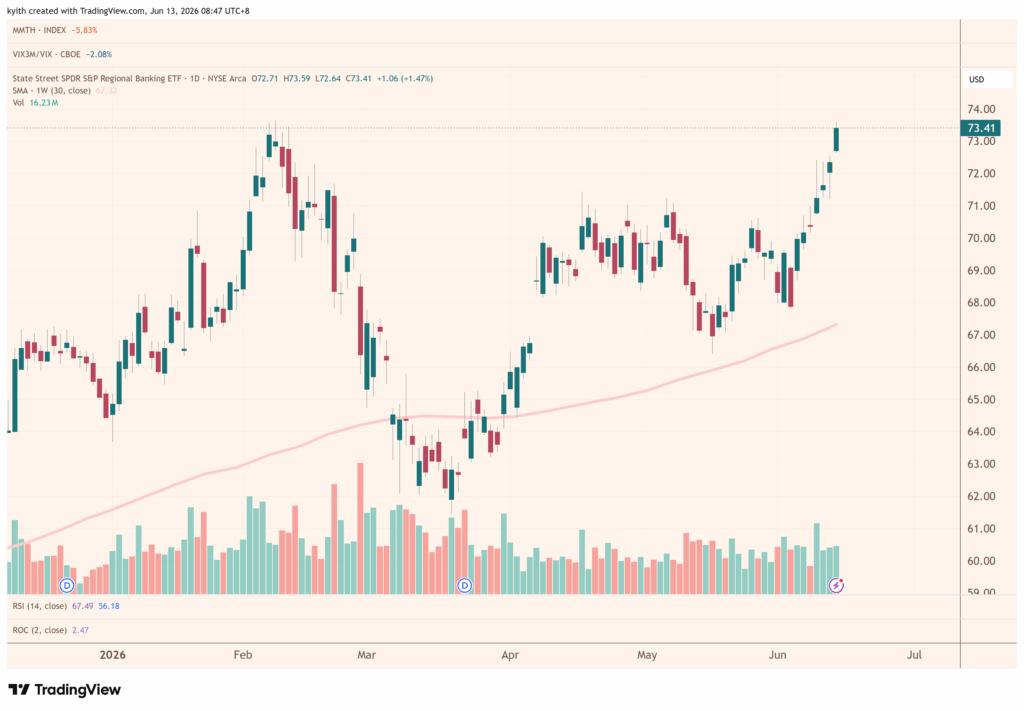
This is the chart of State Street SPDR S&P Regional ETF (KRE) for most of 2026:

It tracks the S&P Regional Banks Select Industry index and incepted in 2006 [20 years of history]. It has 147 holdings with the average market cap U$7.7 billion. Price to book about 1.26 times, Price earnings 11.6 times or 8.6% earnings yield.
The top 10 holdings: Popular Inc, East West Bancorp, Zions Bancorp, Valley National Bancorp, UMB Financial, Western Alliance Bancorp, Bank OZK, Flagstar Bank, Associated Banc Corp, Wintrust Financial Corp.
Not the bank you have heard of.
You can see the start of a year a pretty nice run up of 13.6%, then it went nowhere from 5th Feb to 1st Jun. That is around 3.9 months.
There were quite a fair bit of private credit scare and it is understandable investors think that they may be implicated.
The market also think that if the Federal Reserve lower the interest rates 3-4 times, it will create a steeper yield curve. If the market holds up, then a lower interest will reduce their funding, improve bank’s net interest margin and move more volume.
But in a way, perhaps the market priced in too much good expectations and when the Iran war started, the market priced in too much negativeness.
In Feburary:
- Rate cuts coming in 2026 → NIM expansion from both repricing and curve steepening
- Inflation fading → benign credit environment
- Soft landing → loan growth acceleration
- Tech-to-financials rotation → fund flows into bank stocks
When Iran war started:
- No rate cuts, possibly hikes → curve steepening thesis dead
- Inflation surging → Fed stays restrictive or tightens
- Energy shock → recession risk rises → credit quality risk rises
- Risk-off → rotation out of cyclicals like banks
How did the interest rate situation look like from 5th Feb to 1st Jun 2026?
Let’s look at the US yield curve from 5th Feb and 1st Jun:

The red line (5th Feb) moves to the blue line (1st Jun) eventually. We can see that the interest rate went up, and in a way it is flatter.
Both are not too good for bank lending and we can explain for the weakness.
Then it started to move up these 2 weeks in a straight line for about 7.9%.
Did the interest rate picture improved after 1st Jun?
Now lets see the US yield curve from 1st Jun to Today (12/13 Jun):

The purple line shows what would be today’s interest rate relative to 1st Jun and 5th Feb.
There isn’t much difference! In fact interest rate is higher and flatter.
This is observed not only in the smaller financials but also the larger banks:

I overlayed with the KRE the KBWB.
The KBWB holds 26 banks and tracks the Nasdaq Bank index. You would know the top holdings better: Morgan Stanley, Goldman Sachs, Bank of America, JPMorgan, Wells Fargo, State Street, Citigroup, Bank of New York Mellon, PNC Financial, Fifth Third Bancorp.
Did Recent CPI Report point to Future Near-term Rate Cuts?
On Wednesday, we saw the CPI report which should show the level of inflation and indication if there is enough to lower the interest rate.
Basically, the report shows that there are higher inflation on the production and supplier level and this has not filtered to the consumer level. I think in a few months we may see this hit the consumer more.
All told, interest rate sensitive industry should not do well.
Yet on that CPI report, the KRE actually finished higher.
Private Equity Distress
It’s not like during this period, there weren’t any news of private equity or private credit distress.
On 3rd June, Partners Group capped redemptions on its $8.6 billion Global Value SICAV evergreen private equity fund after withdrawal requests hit ~9.8-10% of NAV, limiting withdrawals to 5%. Shares plunged 17%, its worst single-day drop since going public in 2006, dragging down Blackstone, KKR, and Ares in sympathy.
The next day, Partners Group warned it could cap withdrawals across more funds. A Delaware-domiciled US PE vehicle is set to see ~6% redemption requests in Q2, and three other evergreen funds (~$9.7B combined) are likely to see 3.5-5% redemptions. CEO David Layton framed it as private credit liquidity pressure spilling over into private equity
Bloomberg/FA-Mag commentary framed this as a notable first: private equity gates are less common than in real estate or credit since most PE money is locked up institutional capital, but Partners Group is an outlier with ~20% of AUM from wealthy private-bank clients via evergreen vehicles.
Small Banks versus Larger Bank Relationships
This relationship chart shows the KRE divide by the XLF:

It goes back to KRE’s inception in 2006 and you be able to see if over time smaller or large banks do better. I think you can’t say which is which and if it meanders at a line, it means that sometimes smaller does better and sometimes large banks do better. But since 2018 to Oct 2020, which is after COVID, small banks have really suffered.
From Oct 2022 to now, small banks have done more poorly. Lately it has been showing some strength. Question if there is some balance to be restored.
In What World are Higher Interest Rates Better for Banks?
It is hard to imagine with higher interest rates the smaller banks to do well if interest rate remains like this or even hikes.
But if price movement contains information (since the market is like a weighing machine and constantly reprices things with its new information) then what is it telling us?
It may be telling us that Banks may not always need lower rates. Basically, the model that I use to look at the banks was WRONG.
Here are a few things.
1. “Higher for longer” is actually good for bank earnings once the transition pain is over.
There’s a crucial distinction between rates rising rapidly (2022–2023, which was destructive) and rates staying elevated (2025–2026, which is profitable).
A higher-for-longer rate environment with a steeper yield curve should boost net interest income, and so far consumers have held up pretty well.
Think about it mechanically.
If fed funds stays at 3.5–3.75% and the 10-year stays around 4.5%, banks are originating new loans at 6–8%. Their cost of funds has stabilized. They’re earning a fat spread on every new dollar they deploy.
The level of rates allow the banks to earn more (you can see how well DBS, OCBC and UOB did last few years).
The challenge has always been the rate of change.
2. The yield curve already un-inverted. What the banks need is a positive yield and we currently have that.
Going from Long term rates minus short term rates of -93bps (July 2023) to +49bps today is a 142bps swing.
The market was pricing in an existential risk during the deep inversion if this remains too long. That risk has been removed.
The “un-inversion” and subsequent steepening of the yield curve restored the traditional banking model of borrowing short and lending long, and by early January 2026, the KBW Banking Index had officially begun outperforming the broader S&P 500.
+49 bps is not steep but the market isn’t demanding a steep curve. It’s just demanding that the curve is no longer inverted. That condition is met.
3. The repricing tailwind is so powerful it overwhelms the rate outlook.
A regional bank’s earning assets sit in two big buckets:
- The securities portfolio (typically 20–25% of total assets) and
- The loan book (typically 60–70% of total assets).
Both buckets got loaded up with low-yielding assets during 2020–2022, and both are now repricing but on different timelines and through different mechanisms.
The securities portfolio is the underwater bond book.
This is where the 2022–2023 pain was concentrated and where most of the media coverage focused. Banks added nearly $2.3 trillion in securities from the start of 2020 to the end of 2021, when interest rates were low. The subsequent increase in rates is the primary source of unrealized losses. (market interest rates increase, bond value of bonds you held drops). Banks’ securities portfolios are composed primarily of residential mortgage-backed securities (RMBS) and Treasuries. RMBS is the primary contributor to overall aggregate securities losses.
In 2020–2021, the Fed had rates at near-zero. A flood of pandemic-era deposits poured into banks — stimulus checks, PPP, people not spending. Banks had to put that cash somewhere, so they bought:
- US Treasuries yielding 0.5–1.5% [These were around 3 to 10+ Years in Maturity]
- Agency mortgage-backed securities (MBS) yielding 1.5–2.5% [> 15 years]
- Municipal bonds at similarly low rates
They classified much of this as held-to-maturity (HTM) which means that unrealized losses don’t flow through the income statement or regulatory capital (this is the accounting choice that blew up SVB). The rest went into available-for-sale (AFS), where losses hit other comprehensive income but not earnings.
As of Q4, 2025, according to the FDIC 2025 quarterly banking profile:
- Held-to-Maturity (HTM) Securities: $214.5 billion (down 28.5% from the ~$300 billion recorded at the end of 2024).
- Available-for-Sale (AFS) Securities: $110.6 billion (down nearly 40% from its peak).
- Total Portfolio Impact: This combined balance of $325.1 billion marks the lowest level of system-wide unrealized losses since the Federal Reserve began raising interest rates in early 2022. Compare this to Q4 2022, this is $620 billion. The losses has halved.
Investors forget that as goes time, bonds mature and the holders (in this case the banks) get back the principal.
Here’s the key insight even Kyith forgotten: Most RMBS have maturities greater than 15 years coupled with negative convexity, making their price less sensitive to decreasing rates. This means these securities will sit on bank balance sheets for a long time, paying their low coupons, and slowly rolling off.
But “slowly rolling off” is exactly the repricing mechanism. Each quarter, some slice of that portfolio matures, gets paid down, or gets called. The bank takes the cash and either:
- Reinvests in new securities at current market yields (4–5%),
- or Doesn’t reinvest and instead uses the cash to pay down expensive wholesale borrowing.
Commerce Bancshares described roughly $300 million in bonds rolling off at an average yield around 2.98%, potentially being reinvested in the mid to high threes. That’s about 70–100bps of incremental yield on every dollar that reprices — and that’s actually a conservative example because their reinvestment rate was relatively low.
Most banks are allocating fewer funds into these portfolios and seem to have plans to allow them to mature and roll off their balance sheets. Many banks are deliberately choosing not to reinvest at all — they’re letting the bond book shrink and redirecting the cash into higher-yielding loans or paying off FHLB borrowings, which is even more accretive to NIM.
The second bucket is the loan book which makes up the more significant assets.
The securities portfolio gets the headlines, but the loan book is actually where the bigger repricing story lives, because it’s a much larger portion of the balance sheet and the yield pickup is more dramatic.
A typical regional bank’s loan book contains:
Fixed-rate loans — these include:
- Fixed-rate commercial real estate mortgages (typically 5–7 year terms, sometimes 10)
- Fixed-rate residential mortgages (15 or 30 year, though many were sold to agencies)
- Fixed-rate C&I (commercial & industrial) term loans
- Fixed-rate consumer loans (auto, personal)
Adjustable/floating-rate loans — these include:
- Variable-rate C&I lines of credit (often tied to SOFR or prime)
- Adjustable-rate CRE loans
- Construction loans
- Home equity lines
At Prosperity Bancshares, as of September 2025, the total loan portfolio was made up of 36% fixed-rate loans. This ratio varies by bank with some are 30% fixed, others 50%+ but the point is there’s a huge slug of fixed-rate loans made during 2020–2022 that are now coming due.
Here’s how the math works.
Consider a fixed-rate CRE loan originated in 2021:
- Then: 5-year fixed at maybe 3.5%, on a property that appraised well
- Now (2026): That loan matures. The borrower needs to refinance. The new rate? Probably 6.5–7.5%.
That’s a 300–400 basis point pickup on the same dollar of assets, going straight to net interest income. And this isn’t a one-time event — it’s a rolling wave. Every quarter, another tranche of 2020, 2021, and 2022 vintage loans hits its maturity date or repricing date and resets higher.
Regions Financial reported that new production fixed-rate asset yields continue to benefit from elevated long-term interest rates, and they added $4.5 billion of forward-starting hedges beginning throughout 2026 to lock in a portion of expected future loan and securities rate levels. That’s a bank that’s so confident in the repricing tailwind that it’s using derivatives to lock in the benefit.
As a summary here is the rough numbers how the securities and loans portfolio improvement will look like. Take a hypothetical regional bank with $20 billion in total earning assets:
- Securities portfolio: $5 billion, average yield ~3.0% (weighted toward 2020–2021 vintage purchases)
- Loan book: $14 billion, average yield ~5.0% (blended across old fixed-rate and newer/floating)
- Other earning assets: $1 billion
Say 15–20% of the combined portfolio reprices each year (a mix of maturities, amortization, prepayments, and floating-rate resets). That’s roughly $3–4 billion repricing annually.
If the repricing delta is 200bps on average (old yield of ~3.5% replaced with new yield of ~5.5%), that’s:
$3.5 billion × 2.00% = $70 million in incremental annual NII
For context, a bank this size might have total NII of $600–700 million. So repricing alone adds roughly 10% to NII each year — a number that dwarfs whether the Fed moves rates by 25bps in either direction.
A 25bp rate cut would affect NII by maybe $10–15 million at the same bank (depending on asset sensitivity). The repricing engine is 4–5x more powerful than any single rate move.
First Bancorp’s NIM expanded 38 basis points year-over-year, driven by a 5 basis point increase in the yield on earning assets coupled with a 38 basis point decrease in the cost of total liabilities. That 38bp NIM expansion in a single year is enormous — and it’s coming almost entirely from the rolling repricing of old fixed-rate assets plus disciplined deposit cost management, not from any Fed action.
This Runs For Several More Years
The reason this tailwind is so durable is that fixed-rate assets originated in 2020–2022 have staggered maturities:
- 2021 vintage 3-year fixed-rate C&I loans: already repriced in 2024
- 2021 vintage 5-year fixed-rate CRE loans: repricing now in 2026
- 2020–2021 vintage 7-year fixed-rate CRE loans: repricing in 2027–2028
- 2020–2021 vintage 10-year fixed-rate loans: repricing in 2030–2031
- MBS and Treasuries bought in 2020–2021: varying durations, many 5–10 years, some 15–30 years, rolling off gradually through amortization and prepayments
So the short-duration stuff (3-year loans, short Treasuries) has already repriced and is done. The 5-year stuff is repricing right now which is why the Q1 2026 earnings showed such strong NIM expansion. The 7-year and 10-year stuff is still to come. And the long-duration MBS will trickle in for years.
For a bank, a large book of fixed-rate loans made in the low-rate era of 2020–2021 at 3% becomes a NIM drag when funding costs rise to 4–5%. But once those loans mature and reprice, the drag reverses into a tailwind.
This is why the market is bidding up KRE despite “higher for longer.” The repricing wave is mechanical, predictable, and multi-year. It doesn’t need the Fed to do anything. It just needs time to roll through the balance sheet. And we’re only partway through it
4. Rising rates risk scenario may only be marginal – And that may not be necessary bad.
Futures markets are pricing levels near 3.8% by late 2026 and around 4% by mid-2027. That’s only 5–30bps above where we are now.
The market isn’t pricing a return to 5.5%. It’s pricing rates staying roughly here, possibly drifting slightly higher. That’s a world where banks earn more on new loans, not less. The market is fine with it because it understands the mechanics have changed.
5. Banking Deregulation Tailwind
This is probably the single biggest reason KRE and BKX are running, and it’s unrelated to the rate debate:
The Federal Reserve, FDIC, and OCC jointly proposed overhauling U.S. bank capital rules in March 2026, replacing the 2023 Basel III Endgame proposal with a reduced-stringency framework estimated to provide $87.7 billion in system-wide CET1 relief with reductions of roughly 5.2% for large regional banks and 7.8% for smaller banking organizations.
The March 2026 proposals revisit Basel III Endgame for the largest firms, introduce a separate approach for regional and smaller banks, and revise the GSIB surcharge framework. Taken together, the package lowers capital requirements overall, reduces duplication, and improves the economics of traditional lending in ways that could pull some activity back toward banks.
Deregulation is widely expected to help traditional banks compete more effectively with private credit firms. It could allow banks to hold less capital against loans and hold riskier, non-investment-grade loans on their balance sheets, changing the game and unlocking a whole new source of revenue.
Lower capital requirements mean banks can do more with the same equity base: more lending, more buybacks, higher ROE. For a sector trading at 11–13x earnings, that’s a powerful re-rating catalyst.
Even Other Interest Rate Sensitive Sector ETFs Look Good
Here is the State Street Real Estate Sector ETF (XLRE):

Here’s my proxy for REIT health, the Vanguard Real Estate ETF (VNQ):

Both are suppose to be interest rate sensitive and we can see they have not done well but in an environment where there is going to have less rate cuts and potential hikes, either market is not pricing in shit or that they are shrugging things off.
I won’t use the traditional interest rate sensitive utilities because they are partly A.I. build out beneficiary and if there are positivity, I am not sure if it is them shrugging off interest rates.
But that in itself is also interesting: If an interest rate sensitive sector does well despite less favorable future rate expectations, then isn’t that something to think about?
What Determines Prices is Ultimately Not One Factor.
Sometimes, do be open that your model of how things work may not be the most complete. We been in a rising rate environment recently, and banks can still earn pretty good profits. Their share price might not look the best always, and that is why we need to remember the second statement.
Sometimes, you got to be aware that you might be investing in a different time frame. In that time frame, you are going to see a few interest rate rises, interest rates fall, interest rates that seem to be going to rise but don’t rise, interest rates that is going to fall but didn’t fall.
In that time frame, you want to think do you wish to be bother having to consider all these things time and again as a retail investor?

Do Like Me on Facebook. I share some tidbits that are not on the blog post there often. You can also choose to subscribe to my content via the email below.
If you’re thinking of opening an Interactive Brokers account, my referral link is here.
As the new account holder, you’ll receive USD 1 in IBKR stock for every USD 100 you deposit, up to USD 1,000 in shares — so a USD 10,000 deposit gets you USD 100 in IBKR stock, and the bonus is capped at USD 1,000 for deposits of USD 100,000 or more. A few other things to know: the minimum deposit to qualify is USD 10,000, done within 30 days of opening, and the bonus shares are locked up for one year from the award date. The promotion is currently active, and using the link costs you nothing extra. On a separate note, if you haven’t already, it’s worth taking a look at how IBKR’s share price has performed over the past five years — the stock you receive as a bonus isn’t just a token; it’s a stake in a company that has done quite well for its shareholders.
I break down my resources according to these topics:
- All my personal notes about how my philosophy behind my own money and how I manage it.
- Building Your Wealth Foundation – If you know and apply these simple financial concepts, your long term wealth should be pretty well managed. Find out what they are
- Active Investing – For active stock investors. My deeper thoughts from my stock investing experience
- Learning about REITs – My Free “Course” on REIT Investing for Beginners and Seasoned Investors
- Dividend Stock Tracker – Track all the common 4-10% yielding dividend stocks in SG
- Free Stock Portfolio Tracking Google Sheets that many love
- Retirement Planning, Financial Independence and Spending down money – My deep dive into how much you need to achieve these, and the different ways you can be financially free
- Providend – Where I work and do research. Fee-Only Advisory. No Commissions. Financial Independence Advisers and Retirement Specialists. No charge for the first meeting to understand how it works
Kyith is the Owner and Sole Writer behind Investment Moats. Readers tune in to Investment Moats to learn and build stronger, firmer wealth foundations, how to have a Passive investment strategy, know more about investing in REITs and the nuts and bolts of Active Investing.
Readers also follow Kyith to learn how to plan well for Financial Security and Financial Independence.
Kyith worked as an IT operations engineer from 2004 to 2019. Currently, he works as a Senior Solutions Specialist in Fee-only Wealth Advisory Firm Providend. All opinions on Investment Moats are his own and does not represent the views of Providend.
You can view Kyith’s current portfolio here, which uses his Free Google Stock Portfolio Tracker.
His investment broker of choice is Interactive Brokers, which allows him to invest in securities from different exchanges all over the world, at very low commission rates, without custodian fees, near spot currency rates.
You can read more about Kyith here.

Apple AirPods Pro 3 Wireless Earbuds, Active Noise Cancellation, Live Translation, Heart Rate Sensing, Hearing Aid Feature, Bluetooth Headphones, Spatial Audio, High-Fidelity Sound, USB-C Charging
(as of July 14, 2026 02:54 GMT +00:00 - More infoProduct prices and availability are accurate as of the date/time indicated and are subject to change. Any price and availability information displayed on [relevant Amazon Site(s), as applicable] at the time of purchase will apply to the purchase of this product.)
Dr. Elsey's Ultra UnScented Clumping Clay Cat Litter 40 lb. Bag
(as of July 14, 2026 02:40 GMT +00:00 - More infoProduct prices and availability are accurate as of the date/time indicated and are subject to change. Any price and availability information displayed on [relevant Amazon Site(s), as applicable] at the time of purchase will apply to the purchase of this product.)
Amazon Kindle 16 GB (newest model) - Lightest and most compact Kindle, now with faster page turns, and higher contrast ratio, for an enhanced reading experience - Matcha
(as of July 14, 2026 03:08 GMT +00:00 - More infoProduct prices and availability are accurate as of the date/time indicated and are subject to change. Any price and availability information displayed on [relevant Amazon Site(s), as applicable] at the time of purchase will apply to the purchase of this product.)
Comfort Expression Orthopedic Dog Bed for Extra Large Dogs with Bolster | Waterproof Dog Couch Bed with Washable Cover & Non-Slip Bottom, Supportive Egg Crate Foam XL Pet Bed, 42x30 Inch
(as of July 14, 2026 02:51 GMT +00:00 - More infoProduct prices and availability are accurate as of the date/time indicated and are subject to change. Any price and availability information displayed on [relevant Amazon Site(s), as applicable] at the time of purchase will apply to the purchase of this product.)


Post Comment