Why ARB’s Sharp Slide Could Be the Wake-Up Call Traders Have Been Blindly Waiting For — Are You Ready to Rethink Your Strategy?

Alright, let’s get real for a sec — Arbitrum’s ARB token is careening toward uncharted lows, and if you blinked, you might’ve missed the double-digit bloodbath in the last 24 hours alone. Sitting a staggering 96% below its all-time high, this isn’t just a dip; it’s a full-blown rout. Now, here’s the kicker — both on-chain and off-chain signals are flashing red like a Wall Street trading floor at panic hour, underscoring a tidal wave of selling pressure and faltering fundamentals. So, the question begs — is ARB simply catching a cold, or are we witnessing the early signs of a deeper malaise that could send the altcoin limping lower? The unprecedented liquidation disparity — longs getting crushed nearly a hundredfold compared to shorts — might just have your answer. And if stablecoins are sprinting for the exits on the Arbitrum chain, well, that’s no coincidence. Buckle up, because this isn’t your average market wobble; it’s a hard lesson in sentiment, liquidity, and the brutal dance between hope and reality. LEARN MORE
Arbitrum’s ARB risks printing a new low on the back of bearish pressure building across the market. In fact, the token has registered double-digit losses over the last 24 hours, with the crypto trading roughly 96% below its all-time high at press time.
On-chain and off-chain readings both seemed to point to deep selling pressure and weakening fundamentals. Those signals, together, have been weighing on the altcoin’s near-term outlook.
Long liquidations dwarf shorts on ARB
The sharpest signal over the past 24 hours was the lopsided liquidation split. At the time of writing, it showed up clearly in the perpetual futures market.
ARB liquidation data revealed which side of a perpetual market the price was working against. Ordinarily, a liquidation closes a leveraged position once the market moves past its margin, and the depth of those forced losses tells the story.
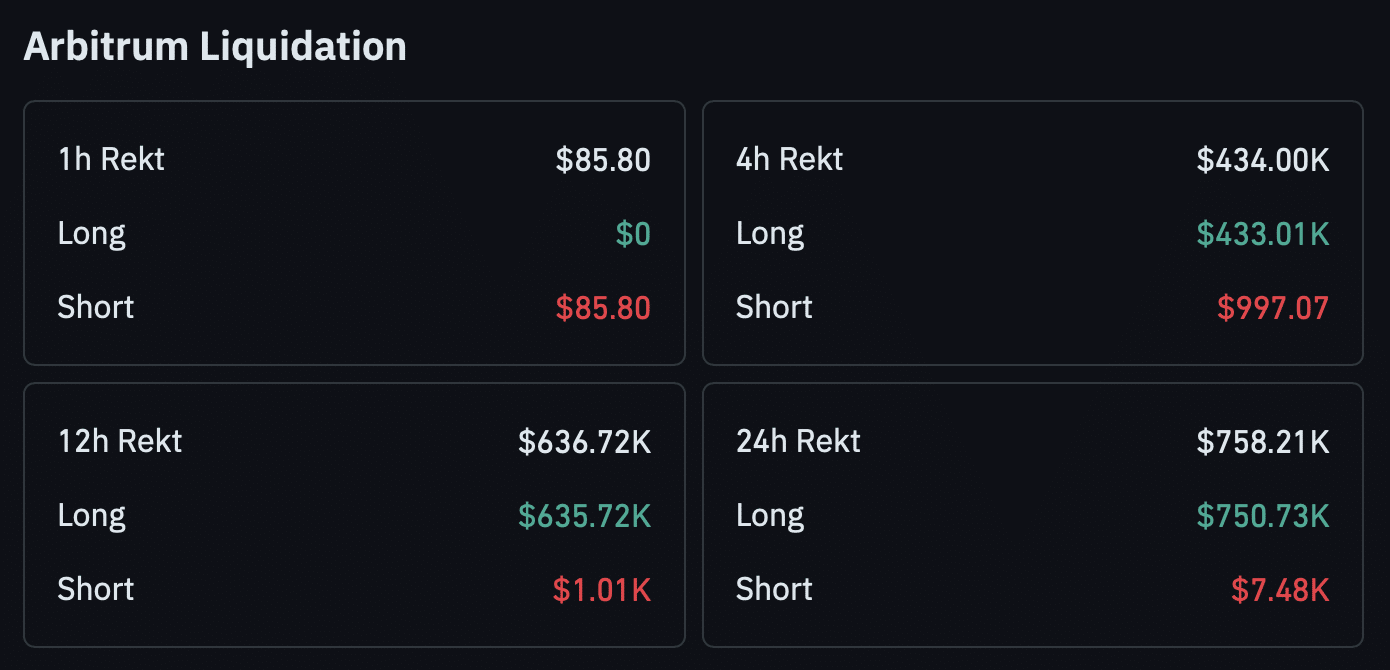
Long traders absorbed $750,730 in liquidations over the period. Short positions lost just $7,480 across the same window, showing the market may have moved firmly against bullish bets. For every $1 wiped from short positions, longs lost close to $100.
The liquidation heatmap still left room for a bounce though. Unfilled liquidity clusters seemed to sit above the press time price and could pull it higher. Still, the downside case remained dominant, with targets near $0.074 if selling continues.
Stablecoins drain from the Arbitrum chain
On-chain flows also reinforced the bearish read as liquidity drained from the network. In fact, network activity stalled at the same time too, thinning the bullish case.
Stablecoins have left Arbitrum faster than they have entered it since 15th June. Only a single day of net inflows showed up across that stretch.
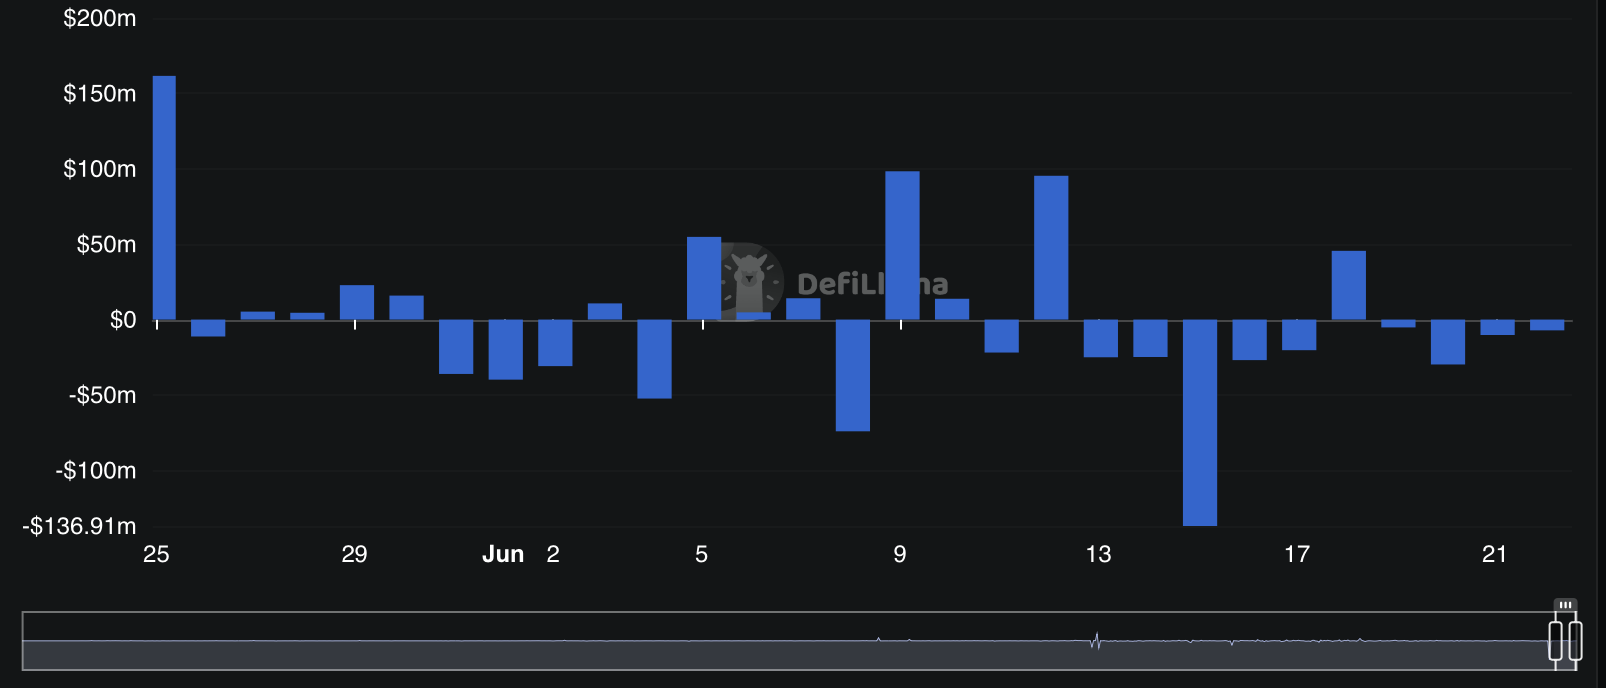
Outflows totaled $236.48 million against $45.58 million in inflows over the period. That leaves a net outflow of $190.9 million from the chain. A drain that size usually tracks users heading for the exits, since netflows normally stay minimal in either direction.
Total value locked remained broadly flat over the same window. No meaningful capital entered or left, with the figure sitting near $1.285 billion. A flat TVL of this kind tends to allude to investors waiting on the sidelines, unsure of where the token might head next.
ARB tests a key chart support
On the price charts, ARB seemed to be trading into a key support level. That zone has driven three separate rallies in the past, and it would ordinarily set up another rebound from here.
However, indicators pointed to heavy selling at press time levels instead.
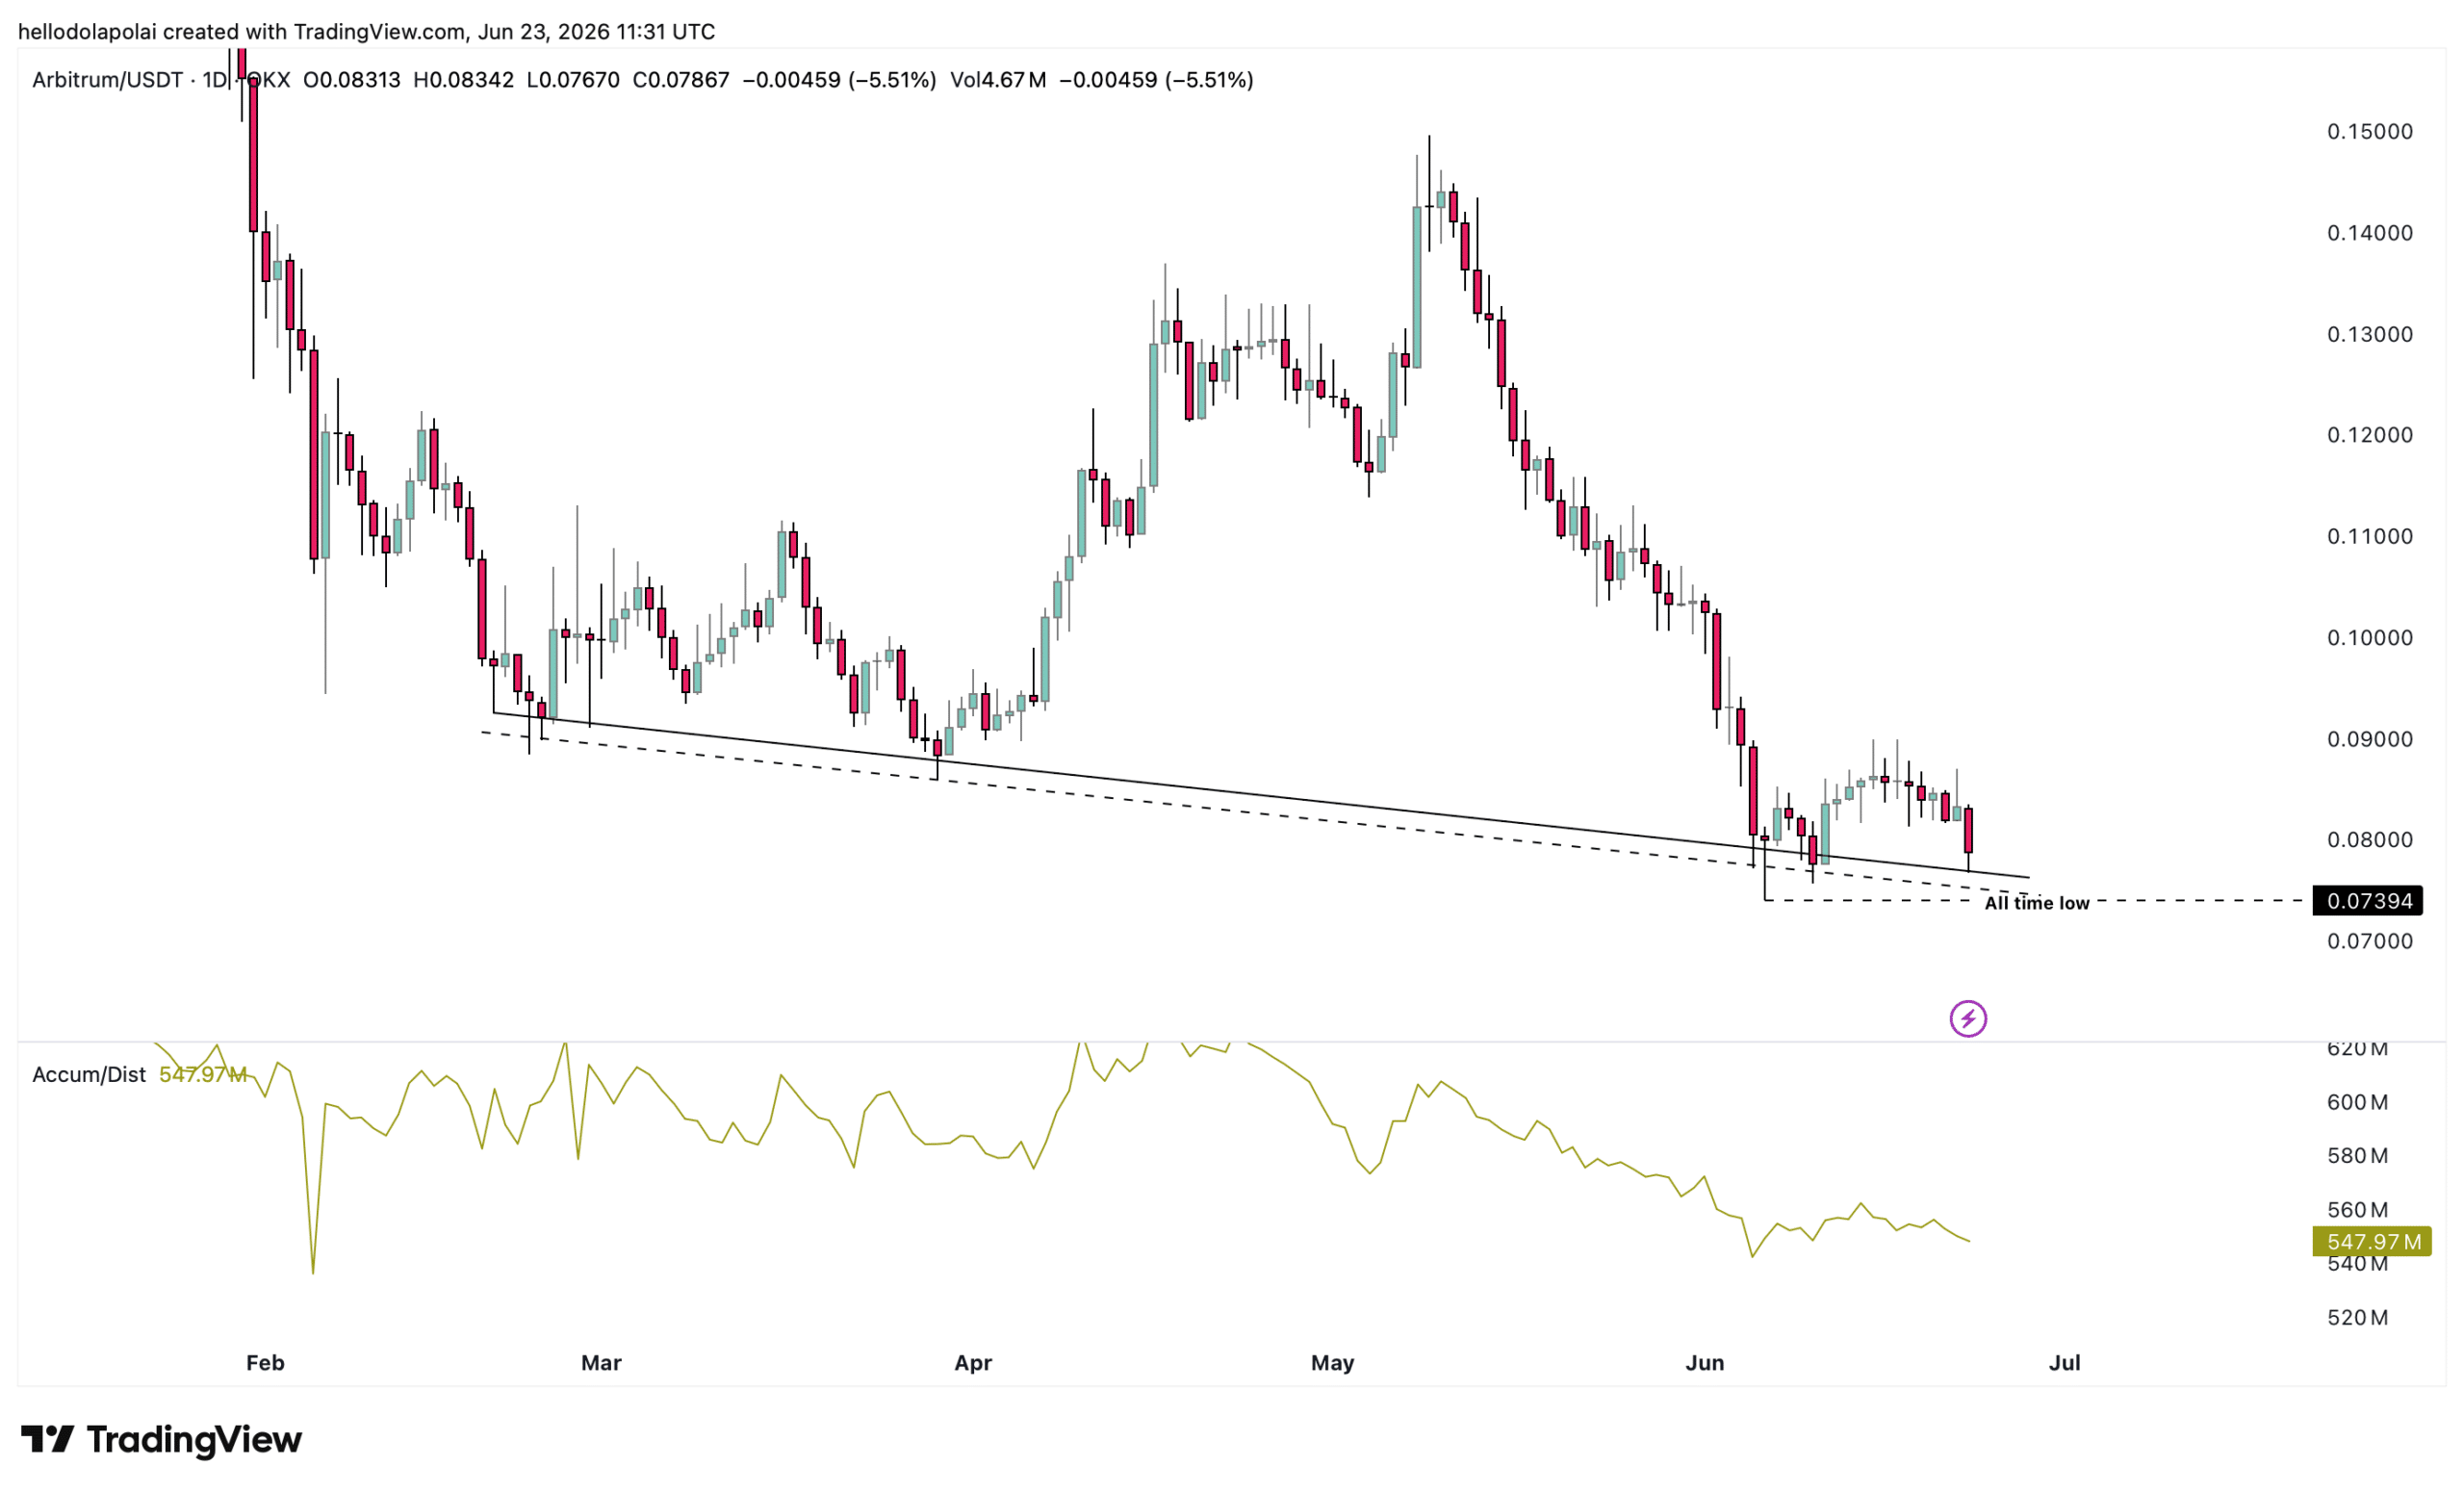
The accumulation/distribution reading showed holders steadily offloading ARB into the market. In fact, total volume hit 547.99 million ARB as the price traded lower on the charts
Should pressure keep building, ARB could slide towards $0.073, the floor it last touched on 6th June.
Final Summary
- Traders who bet on a price recovery have lost far more than those betting on a fall; a clear sign that sellers may have the upper hand.
- Money has steadily left the Arbitrum network this month, pointing to users pulling back and fading confidence.

Amazon Echo Spot (newest model), Great for nightstands, offices and kitchens, Smart alarm clock, Designed for Alexa+, Black
(as of July 15, 2026 03:08 GMT +00:00 - More infoProduct prices and availability are accurate as of the date/time indicated and are subject to change. Any price and availability information displayed on [relevant Amazon Site(s), as applicable] at the time of purchase will apply to the purchase of this product.)
Kirecoo 2 Pack Stainless Steel Litter Box with Lid, Medium Enclosed Metal Cat Litter Box Pan High Sided, Easy Clean Anti-Leakage Litterbox Tray for Cats, Kittens or Multicat, Bunny, Scoop Included
(as of July 15, 2026 02:50 GMT +00:00 - More infoProduct prices and availability are accurate as of the date/time indicated and are subject to change. Any price and availability information displayed on [relevant Amazon Site(s), as applicable] at the time of purchase will apply to the purchase of this product.)
Smiry Dog Door Mat for Muddy Paws, Absorbent Dirt Trapper Non Slip Quick Dry Washable Chenille Mat for Mud Dogs, Entry Rug for Indoor and Outdoor (30x20 Inches, Grey and Black)
(as of July 15, 2026 02:51 GMT +00:00 - More infoProduct prices and availability are accurate as of the date/time indicated and are subject to change. Any price and availability information displayed on [relevant Amazon Site(s), as applicable] at the time of purchase will apply to the purchase of this product.)
Coca-Cola Zero Sugar Soda Soft Drink Fridge Pack Cans, 12 fl oz, 12 Pack
(as of July 15, 2026 02:46 GMT +00:00 - More infoProduct prices and availability are accurate as of the date/time indicated and are subject to change. Any price and availability information displayed on [relevant Amazon Site(s), as applicable] at the time of purchase will apply to the purchase of this product.)


Post Comment