Why This 5% Yield Asia Pacific Dividend ETF Has Locked Your Returns for 20 Years – And What It Means for Your Portfolio
Ever wonder if chasing high dividends in the Asia Pacific market is like hunting for buried treasure—or just chasing mirages? After wrapping up a deep dive into Universal Life methodologies at work, I found myself poking around an intriguing fund I hadn’t really given much thought to before: the iShares Asia Pacific UCITS Dividend ETF. It’s been quietly paying dividends since 2006, carving out nearly two decades of history in a market often dismissed as volatile and unpredictable. What grabbed my attention? This ETF systematically targets the top 50 dividend-yielding stocks in the region, renewing its lineup annually, with a yield that hovers around 5%. But here’s the kicker—is this consistent income stream truly golden, or is there a catch hiding beneath the surface? Stick with me as we unravel the real story behind this fund’s performance, methodology, and what it means for investors seeking both growth and income in a complicated market landscape. LEARN MORE
img#mv-trellis-img-1::before{padding-top:24.12109375%; }img#mv-trellis-img-1{display:block;}img#mv-trellis-img-2::before{padding-top:60.25390625%; }img#mv-trellis-img-2{display:block;}img#mv-trellis-img-3::before{padding-top:23.92578125%; }img#mv-trellis-img-3{display:block;}img#mv-trellis-img-4::before{padding-top:49.12109375%; }img#mv-trellis-img-4{display:block;}img#mv-trellis-img-5::before{padding-top:38.18359375%; }img#mv-trellis-img-5{display:block;}img#mv-trellis-img-6::before{padding-top:20.01953125%; }img#mv-trellis-img-6{display:block;}img#mv-trellis-img-7::before{padding-top:56.4453125%; }img#mv-trellis-img-7{display:block;}img#mv-trellis-img-8::before{padding-top:24.043715846995%; }img#mv-trellis-img-8{display:block;}
I have just finished my review of our Universal Life methodology at work and came back from a huddle. I decided that since I have not spend some time looking at MVOL, or the iShares Edge MSCI World Minimum Volatility UCITS ETF so decided to take a look.
And why not browse through a list of iShares available UCITS ETF.
I managed to find this iShares Asia Pacific UCITS Dividend ETF. This ETF has both accumulating and distributing class of ETF.
I think the ticker is a little confusing so I think it is like this:
| Exchange | Ticker | Currency |
|---|---|---|
| London Stock Exchange | IAPD | GBP |
| London Stock Exchange | IDAP | USD |
| Deutsche Börse Xetra | IQQX | EUR |
| Borsa Italiana | IAPD | EUR |
| SIX Swiss Exchange | IAPD | USD |
What should interest most of you is the IDAP.
There are a few things why I think we should review the Asia Pacific Dividend ETF:
- This fund invest in the Top 50 dividend yielding stocks in the Asia Pacific universe.
- This means that it invest in 50 stocks.
- Since it is a systematic-active ETF, every once a year in March, it will rank by dividends, adjust based on company and region restrictions and reconstitute the portfolio again. So you have a constantly rejuvenating fund that is systematic.
- It pays dividend since 2006, which means we have almost 20 years of fund history to see how the results is like
The fund was incepted in 02 Jun 2006
The fund total expense ratio is 0.59% and its annualized return since inception is 6.5% p.a. if we use End May 2026. Not the best return but you can tell me if you are looking for income, if you invest for 20 years and get 6.5% p.a. return will you be happy.
This fund is listed on the European stock exchange including London. It is Irish domiciled so it should be more withholding and estate tax optimized. Ireland don’t levy a dividend withholding tax on its distribution to non-resident investors and Ireland has some of the best dual-taxation treaty network with other countries, and these will optimize your withholding tax. This is something I learn recently as well.
It is weird how come we have such a long history of Asia Pacific UCITS ETF but I suspect this is a popular fund during the Asia/Emerging market hey days of 2000-2010 and managed to survive.
The current full year dividend distribution yield is about 5.0%.
Now let us take a look at the data.
The Methodology for the Top 50 Dividend Stocks Index.
This fund helps you automate the securities screening and invest in top dividend stocks. It also helps you to remove those stocks that stop giving top dividends.
The fund tracks the Dow Jones Asia/Pacific Select Dividend 50 Index (Net) index.
This is the methodology.
1. Starting from a universe of securities
All companies in the S&P BMI country indices for Australia, Hong Kong, Japan, New Zealand, and Singapore, excluding REITs.
2. Eligibility screens (a stock must pass these to even be considered)
- Listed on an exchange in the APAC region
- Paid dividends in each of the previous 3 years
- Dividend-per-share ≥ its own 3-year average DPS (i.e., not cutting its dividend)
- 5-year average dividend coverage ratio ≥ two-thirds of its country’s average (or ≥118%, whichever is greater) — basically a sustainability check on whether earnings cover the dividend
- Non-negative trailing 12-month EPS
- Float-adjusted market cap (FMC) of at least US$600 million (US$400m for existing constituents — a lower bar so current holdings aren’t bounced out too easily)
- Average daily traded value of at least US$3 million over 3 months (US$1.5m for existing constituents)
Existing constituents get a pass on the dividend-growth and EPS screens — only new entrants need to clear those.
3. Selecting the 50 names (the “buffer” mechanism)
This is the key to limiting unnecessary turnover:
- Rank all eligible stocks by indicated annual dividend (IAD) yield (dividend ÷ price, excluding special dividends)
- Any new stock ranked in the top 25 automatically gets in
- Existing constituents are kept as long as they’re still ranked in the top 80 — added in rank order until the count hits 50
- If 50 still isn’t reached, fill remaining slots with the next-highest-ranked new stocks
- Cap: no more than 25 companies from any single country
So a stock already in the index can fall quite a bit in the rankings (down to 80th) before getting dropped, while a newcomer needs to crack the top 25 to get in — this favors stability over chasing the latest yield rankings.
4. Weighting
Not simple yield-weighting. Each stock gets a “tilted” IAD yield = (IAD yield, capped at 20%) × √(its float-adjusted market cap). This tilts weight toward larger, more liquid companies rather than letting a small, high-yielding stock dominate. Then several caps are layered on:
- No single issuer > 10%
- No single GICS sector > 30%
- Aggregate weight of all stocks individually weighted above 4.5% can’t exceed 22.5% of the index
There’s also a daily capping check: if the combined weight of stocks above 4.8% exceeds 24% on any given day, the index gets recapped intra-year (with a freeze window around the annual rebalance).
5. Reconstitution timing
- Annual, effective at the open on the Monday following the third Friday of March
- Data reference date (fundamentals) is the last business day of December
- Price/dividend data for the yield ranking is taken as of the third Friday of February
- Index shares are assigned based on prices 12 business days before the rebalance
So in short: it’s a yield-screened, buffer-protected, cap-weighted dividend index — designed to capture high-yield Asia-Pacific stocks while limiting both excessive single-stock concentration and unnecessary annual turnover.
Performance of the Asia Pacific Dividend UCITS ETF
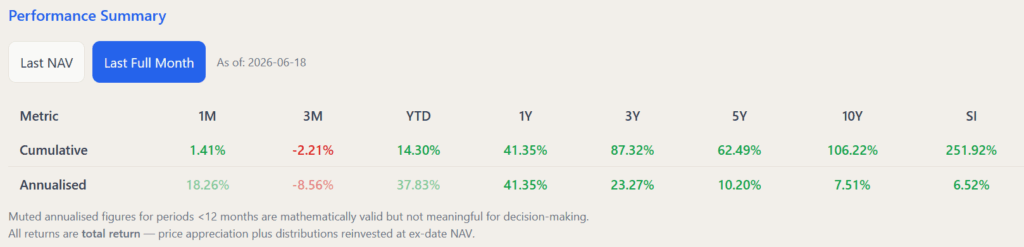
Here is the historical performance to End May 2026:

The last few years have been pretty decent for the Asia Pacific region. They manage to do well. You can see the annualized return for 3 years is above 20% p.a., 5 years is above 10% p.a.
But how well would it do against a broader based Asia Pacific Index in the same time frame?
We can compare it to the MSCI All Country Asia Pacific Index over the same time frame:
- Since inception: 6.4% p.a.
- 10 years: 10.5% p.a.
- 5 years: 8.3% p.a.
- 3 years: 23.2% p.a.
So the Asia Pacific Dividend UCITS ETF did well since inception but we can see it didn’t do as well over the 5 years time frame.
Actually these numbers would look like the Schroder Asian Growth fund that I profiled last week.
This heat map shows the performance month by month:

The end of the calendar year numbers are to the right.
The Rolling Annualized Returns show Short Time Frame Returns are Bad:

You can see if we roll over 5 year, 10 year periods the median returns is 2.77% p.a. and 2.99% p.a.
Asia has struggled in the past 20 years and yes some of your friends got the 10% p.a., that may not be you.
You could have invested for 5 years and got -5.6% p.a.!
The NAV per Share of the Asia Pacific Dividend Fund Stagnates
The NAV per share allows you to see after the manager decides to pay out an income distribution, does the NAV per share trend downwards, or upwards over time?
We tend to observe if the payout is too aggressive, or a fund is mismanaged the NAV would not go up. I won’t say if it is good or bad because it is less clear. But if you want a high payout sometimes the downside may be the NAV faced a lot of pressure.
Here is how the Asia Pacific Dividend Fund NAV trend:

This is a 20-year spanning chart and you can see that the NAV went nowhere.
Risk Metrics
We are also able to profile the fund with some common metric such as Sortino ratio, Sharpe ratio and volatility.

The volatility, as measured by Standard Deviation is 20%, which is pretty standard for the emerging market region. Interesting thing is that Asia Pacific should be closer to developed markets and less volatile but that is not the case.
The metrics actually show that dividends don’t make the portfolio calmer.
If You Buy the Fund at Any Point, You get a 4-6% Income Distribution. But Your Distribution Does Not Grow.
I think when I observe the 3 funds profile so far, that is what I get.
Here’s the distribution if we tally them yearly:

This fund pays out distribution quarterly. The first and last year happen to have 2 distributions so you can ignore them.
Notice the dip in payout after the GFC. Also the dip in payout for COVID year.
But what you should gather is that if you put in $1 million in 2006, you get income regularly but:
- Your income is volatile.
- Your income does not grow
- Your income is uncertain.
Here is the income in detail:

The distribution per year and the yield on initial NAV allows you to visualize if you put in $1 million in 2006, what kind of income you will get and it will go like this:
- 2006: $26,000
- 2007: $70,000
- 2008: $68,800
- 2009: $38,500
- 2010: $51,000
- 2011: $63,200
- 2012: $63,500
- 2013: $63,400
- 2014: $68,600
- 2015: $52,800
- 2016: $50,000
Would you be satisfy with only taking this distribution? I think lets also admit that if you earn 20 years of distribution but volatile that is still a pretty decent experience.
You would just need to manage the income volatility.
The Prevailing Yield will show you say if you put in $1 mil in 2019, your yield would have been 5.55%.
Epilogue
After reviewing quite a fair bit of funds, I tend to think that those folks who practice their own dividend investing, if they don’t add capital, their experience will be more or less like these funds.
Because they always add capital, they just don’t feel it.
Specific for this fund, there is no screening for low dividend payout ratio, so the dynamics of high dividend yield will push the fund to 50-stocks with relatively high payout ratio.
And usually, the income don’t grow well.
If you expect a straight line upwards growth of dividends you are not gonna get it here.
You Might Want to Check Out Some Other Income Distribution Fund Profile I did in the past
You might be interested to take a look at some of the funds that I use Skadi to generate:

Do Like Me on Facebook. I share some tidbits that are not on the blog post there often. You can also choose to subscribe to my content via the email below.
If you’re thinking of opening an Interactive Brokers account, my referral link is here.
As the new account holder, you’ll receive USD 1 in IBKR stock for every USD 100 you deposit, up to USD 1,000 in shares — so a USD 10,000 deposit gets you USD 100 in IBKR stock, and the bonus is capped at USD 1,000 for deposits of USD 100,000 or more. A few other things to know: the minimum deposit to qualify is USD 10,000, done within 30 days of opening, and the bonus shares are locked up for one year from the award date. The promotion is currently active, and using the link costs you nothing extra. On a separate note, if you haven’t already, it’s worth taking a look at how IBKR’s share price has performed over the past five years — the stock you receive as a bonus isn’t just a token; it’s a stake in a company that has done quite well for its shareholders.
I break down my resources according to these topics:
- All my personal notes about how my philosophy behind my own money and how I manage it.
- Building Your Wealth Foundation – If you know and apply these simple financial concepts, your long term wealth should be pretty well managed. Find out what they are
- Active Investing – For active stock investors. My deeper thoughts from my stock investing experience
- Learning about REITs – My Free “Course” on REIT Investing for Beginners and Seasoned Investors
- Dividend Stock Tracker – Track all the common 4-10% yielding dividend stocks in SG
- Free Stock Portfolio Tracking Google Sheets that many love
- Retirement Planning, Financial Independence and Spending down money – My deep dive into how much you need to achieve these, and the different ways you can be financially free
- Providend – Where I work and do research. Fee-Only Advisory. No Commissions. Financial Independence Advisers and Retirement Specialists. No charge for the first meeting to understand how it works
Kyith is the Owner and Sole Writer behind Investment Moats. Readers tune in to Investment Moats to learn and build stronger, firmer wealth foundations, how to have a Passive investment strategy, know more about investing in REITs and the nuts and bolts of Active Investing.
Readers also follow Kyith to learn how to plan well for Financial Security and Financial Independence.
Kyith worked as an IT operations engineer from 2004 to 2019. Currently, he works as a Senior Solutions Specialist in Fee-only Wealth Advisory Firm Providend. All opinions on Investment Moats are his own and does not represent the views of Providend.
You can view Kyith’s current portfolio here, which uses his Free Google Stock Portfolio Tracker.
His investment broker of choice is Interactive Brokers, which allows him to invest in securities from different exchanges all over the world, at very low commission rates, without custodian fees, near spot currency rates.
You can read more about Kyith here.

KVIDIO Wired Headphones with Mic, Volume & Playback Control, Over-Ear Foldable Headphones, 3.5mm Plug, 90° Swivel Ear Cups, 4.9ft Tangle-Free Cord for Tablet, Laptop, PC, School, Travel (Black)
$11.39 (as of August 2, 2026 03:06 GMT +00:00 - More infoProduct prices and availability are accurate as of the date/time indicated and are subject to change. Any price and availability information displayed on [relevant Amazon Site(s), as applicable] at the time of purchase will apply to the purchase of this product.)
Cat Grass Treats, Hairball Treatment for Cats, for Indoor Cats, 500 Chews | Fish Oil for Skin & Coat, Taurine for Heart Vision, Digestion, Essential Vitamins of All Ages, Chicken Crunchy & Creamy
$16.99 (as of August 2, 2026 02:57 GMT +00:00 - More infoProduct prices and availability are accurate as of the date/time indicated and are subject to change. Any price and availability information displayed on [relevant Amazon Site(s), as applicable] at the time of purchase will apply to the purchase of this product.)
Amazon Basics Surge Protector Power Strip, 6-Outlet, 790 Joules, Circuit Breaker, LED Indicator, 6ft Extension Cord, White
$11.08 (as of August 2, 2026 02:58 GMT +00:00 - More infoProduct prices and availability are accurate as of the date/time indicated and are subject to change. Any price and availability information displayed on [relevant Amazon Site(s), as applicable] at the time of purchase will apply to the purchase of this product.)
blink plus plan with monthly auto-renewal
$11.99 (as of August 2, 2026 02:58 GMT +00:00 - More infoProduct prices and availability are accurate as of the date/time indicated and are subject to change. Any price and availability information displayed on [relevant Amazon Site(s), as applicable] at the time of purchase will apply to the purchase of this product.)


Post Comment