Is Ethereum’s $2.7K Surge Real or Just Another Trap for Unwary Investors?
Ethereum’s recent rollercoaster makes me wonder—are we witnessing cautious optimism or just the calm before the storm? In the last 24 hours, ETH saw $80.2 million in liquidations, predominantly from long positions, which honestly feels like a whisper compared to the $1.1 billion bloodbath back on January 31. Yet, the mood? Still grim across crypto and stocks alike, like everyone’s clutching their portfolios and hoping for a break. What’s fascinating is how Ethereum whales have bounced back into the green as prices nudged past the $2,000 mark, but there’s a catch—the $2,353 level looms as a tricky battleground where profit-takers might just press pause on any rally. So, can ETH break through the fear and confusion, or is this just another tease in the tug-of-war between bulls and bears? Dive in—there’s more beneath the surface and longer-term charts telling a tale that’s anything but straightforward. LEARN MORE
Ethereum [ETH] saw $80.2 million in liquidations in the past 24 hours, with $65.6 million being long liquidations. These numbers were relatively tame compared to the $1.1 billion in ETH liquidations on the 31st of January.
That did little to lighten the mood around the leading altcoin. Crypto and stock markets were in the same boat of extreme despair after recent losses.
The Ethereum whales’ unrealized profit ratio climbed back into positive territory again as prices pierced the $2k level. While this seemed to suggest bullish momentum can build, AMBCrypto highlighted the $2,353 level as the aggregate realized price.
In other words, the $2.4k area could arrest any potential rally, as ETH holders might exit the market at breakeven, given the extremely fearful conditions. The longer-term trends gave a mixed picture.
The bullish long-term swing structure of ETH

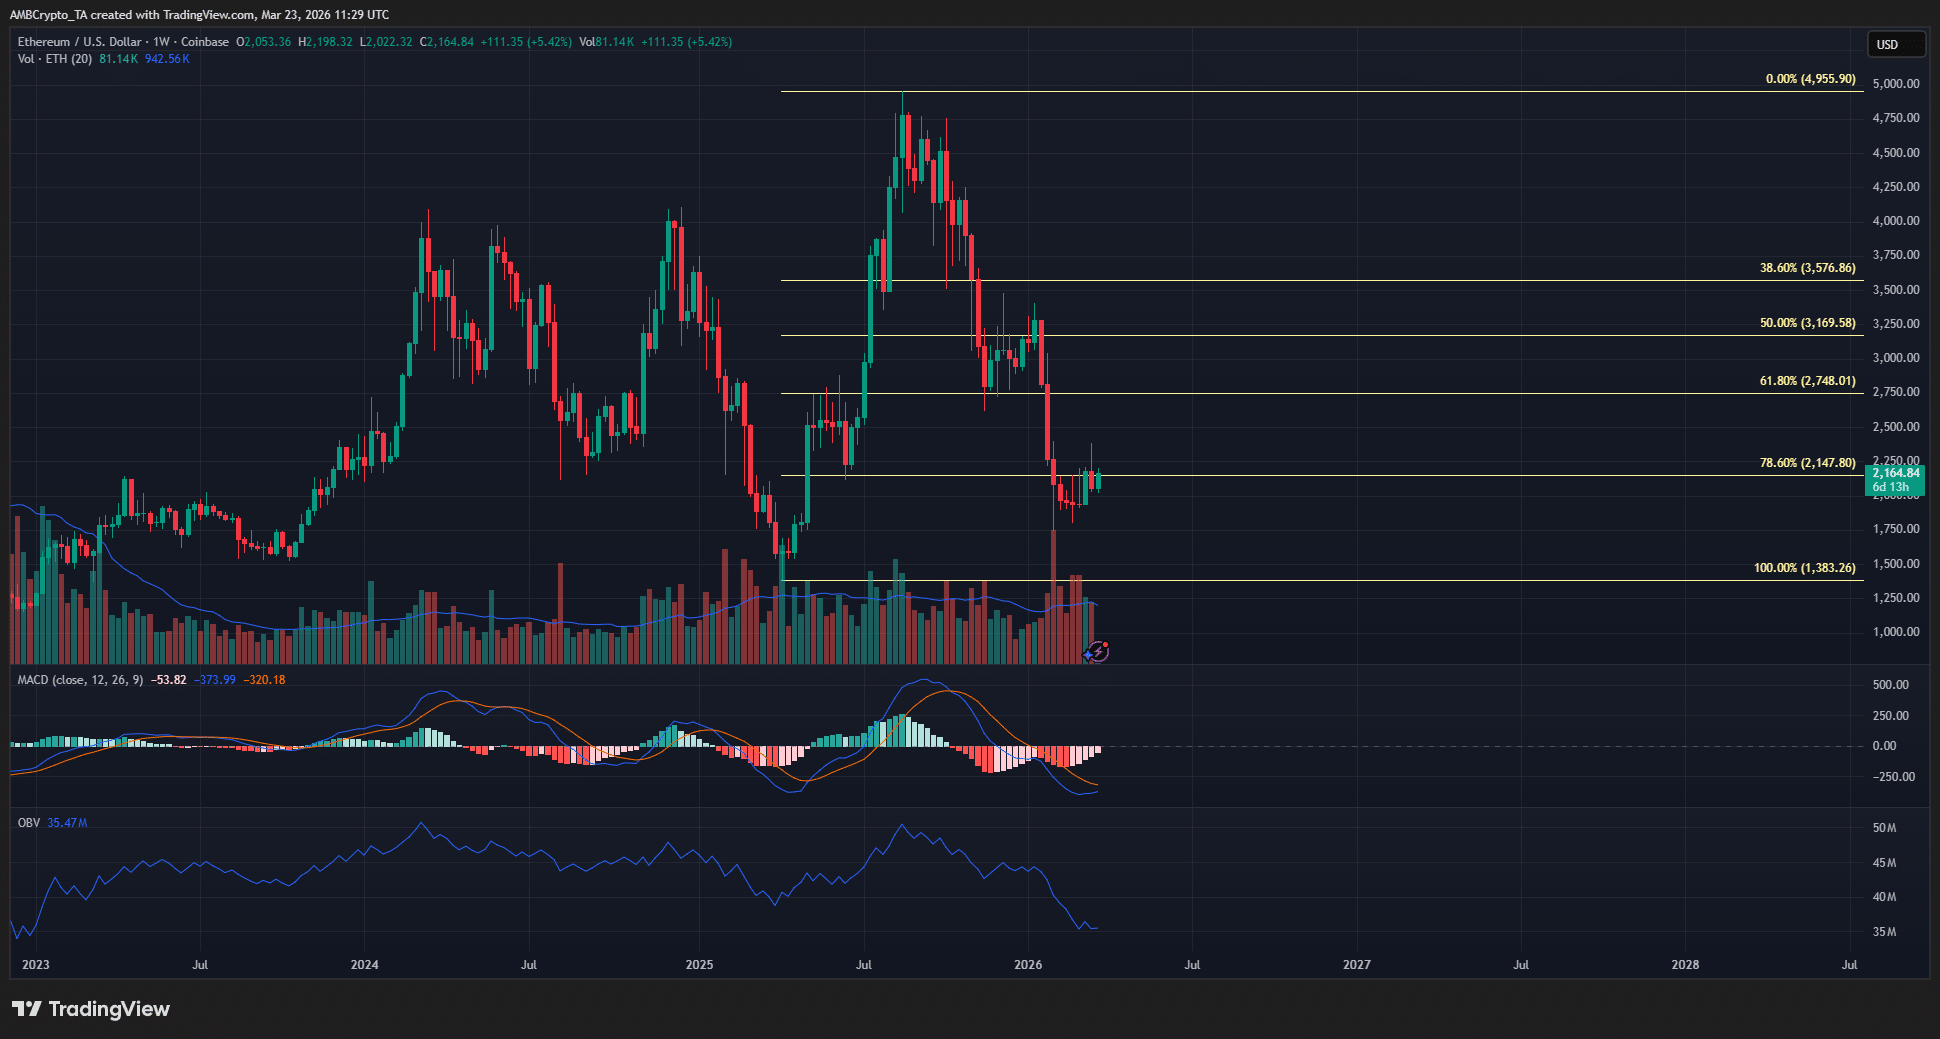
On the weekly timeframe, ETH has a bullish swing structure. Based on the 2025 rally from $1,383 to $4,955, a set of Fibonacci retracement levels was plotted. It showed that the 78.6% level was at $2,147.
The ETH bulls have been fighting to reclaim this retracement level as support since losing it in February and were close to rallying the price back above it.
One concern was that the OBV had made a lower low compared to April 2025. At the same time, the MACD was yet to form a bullish crossover, a sign that higher timeframe momentum has not begun to change.

Meanwhile, the 1-day structure was bearish, and the H4 swing structure was bullish. These were conflicting signs, unlike Bitcoin [BTC], which was bearish on both the weekly and daily timeframes.
Which way should Ethereum investors and traders anticipate the price to go?
Ethereum tends to follow Bitcoin, and the leading crypto has a bearish long-term trend. In the coming weeks, a rally toward $83k-$89k was possible. This could take Ethereum toward the $2,770-$3,049 Fibonacci golden pocket on the daily timeframe.
Therefore, a sustained Bitcoin rally could push ETH toward $2.5k-$2.7k. This was the optimistic scenario. A lack of strong demand, as the OBV’s weekly timeframe lower low hints at, could severely curtail any Ethereum rally.
Investors should also remember the aggregate realized price and the threat of profit-taking if a rally materializes.
Final Summary
- Ethereum gave mixed signals on multiple timeframes. Its bullish weekly and bearish daily charts posed a challenge for investors.
- A rally toward $3k is possible, but it depends on Bitcoin climbing above $80k in the coming weeks and a shift in crypto market sentiment.

YYTKMY Dog Allergy Chews Omega 3 is Human,Itch Relief Multivitamin Medicine for Dogs Itching Skin Relief and Aller Immune Pet Allergy Dog Anti Itch Chews Pills Meds Medicine for Dogs Chicken Flavor
(as of July 15, 2026 02:50 GMT +00:00 - More infoProduct prices and availability are accurate as of the date/time indicated and are subject to change. Any price and availability information displayed on [relevant Amazon Site(s), as applicable] at the time of purchase will apply to the purchase of this product.)
Coca-Cola Zero Sugar Soda Soft Drink Fridge Pack Cans, 12 fl oz, 12 Pack
(as of July 15, 2026 02:46 GMT +00:00 - More infoProduct prices and availability are accurate as of the date/time indicated and are subject to change. Any price and availability information displayed on [relevant Amazon Site(s), as applicable] at the time of purchase will apply to the purchase of this product.)
Dog Cone Collar to Stop Licking, Soft Mesh Recovery Collar After Surgery with Liner, Elizabeth Cone Alternative for Medium and Large Dogs, for Surgery, Spay, Neuter, Wound Care,L,Black
(as of July 15, 2026 02:50 GMT +00:00 - More infoProduct prices and availability are accurate as of the date/time indicated and are subject to change. Any price and availability information displayed on [relevant Amazon Site(s), as applicable] at the time of purchase will apply to the purchase of this product.)
(Pack of 2) Replacement Remote Control Only for Roku TV, Compatible for TCL Roku/Hisense Roku/Onn Roku/Sharp Roku/Element Roku/Westinghouse Roku/Philips Roku Smart TVs (Not for Roku Stick and Box)
(as of July 15, 2026 02:54 GMT +00:00 - More infoProduct prices and availability are accurate as of the date/time indicated and are subject to change. Any price and availability information displayed on [relevant Amazon Site(s), as applicable] at the time of purchase will apply to the purchase of this product.)


Post Comment