EUR/USD Climbs to 1.1730 – Is This the Calm Before a Market Storm or the Start of a Bull Run?
Ever wonder how a single currency pair can stir up a whole day’s buzz in the forex world? Take the EUR/USD for instance — it’s holding tight near 1.1735 during the Asian session, riding on the back of the US Dollar’s recent stumble, which many suspect was nudged by Japan’s quiet market intervention. The Greenback’s weakness isn’t just a blip; with the US Dollar Index flirting with Thursday’s lows near 98.00, it’s clear something’s brewing beneath the surface. Throw in the softer-than-expected Q1 US GDP growth at 2% instead of the anticipated 2.3%, and investors are rightfully twitchy, anticipating the upcoming ISM Manufacturing PMI to tip the scales. Meanwhile, the Euro stands firm, eyes peeled on the ECB’s post-policy chatter. It’s a perfect storm of data, diplomacy, and technical signals that could reshape market sentiment — if you’re smart, you’ll want to be ahead of this curve. Ready to dive deeper? LEARN MORE
The EUR/USD pair clings to Thursday’s gains near 1.1735 during the Asian trading session on Friday. The major currency pair reflects strength as the US Dollar (USD) holds onto the previous day’s losses, which were driven by suspected Japan’s intervention in forex markets.
During the press time, the US Dollar Index (DXY), which tracks the Greenback’s value against six major currencies, trades weakly near Thursday’s low around 98.00.
On Thursday, the US preliminary Q1 Gross Domestic Product (GDP) data arrived weaker than projected. The US Bureau of Economic Analysis (BEA) reported that the economy grew at an annualized pace of 2%, slower than 2.3% estimates.
Meanwhile, investors await the US ISM Manufacturing PMI data for April, which will be published at 14:00 GMT. The Manufacturing PMI is expected to arrive higher at 53.0 from the previous reading of 52.7.
During the Asian trade, the Euro (EUR) trades broadly firm, with investors awaiting commentaries from a slew of European Central Bank (ECB) officials, following the completion of the so-called quiet period after the monetary policy announcement on Thursday.
USD/JPY technical analysis

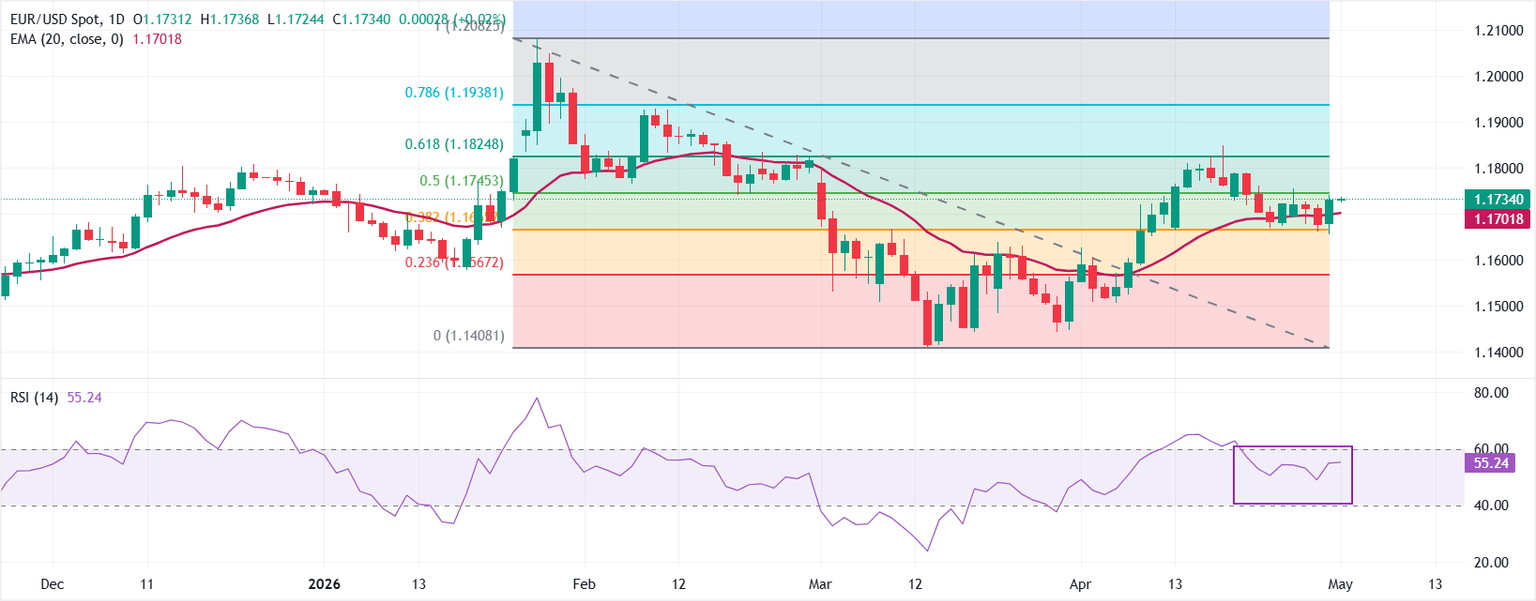
EUR/USD trades firmly at around 1.1735, holding a mildly bullish bias as it sits above the 20-period exponential moving average (EMA) at 1.1702 and between key Fibonacci retracement levels of the latest swing. The pair is hovering just under the 50.0% retracement at 1.1745, suggesting topside progress is slowing but not yet reversing, while the Relative Strength Index (RSI) around 55 hints at constructive, yet not overextended, upside momentum.
On the topside, immediate resistance is located at the 50.0% Fibonacci retracement at 1.1745, followed by the 61.8% level at 1.1825, with further barriers at 1.1938 and 1.2082. On the downside, initial support is provided by the 20-period EMA at 1.1702, ahead of the 38.2% Fibonacci level at 1.1666; a deeper pullback would expose the 23.6% retracement at 1.1567, with the cycle low near 1.1408 acting as a more distant structural floor.
(The technical analysis of this story was written with the help of an AI tool.)
US Dollar FAQs
The US Dollar (USD) is the official currency of the United States of America, and the ‘de facto’ currency of a significant number of other countries where it is found in circulation alongside local notes. It is the most heavily traded currency in the world, accounting for over 88% of all global foreign exchange turnover, or an average of $6.6 trillion in transactions per day, according to data from 2022.
Following the second world war, the USD took over from the British Pound as the world’s reserve currency. For most of its history, the US Dollar was backed by Gold, until the Bretton Woods Agreement in 1971 when the Gold Standard went away.
The most important single factor impacting on the value of the US Dollar is monetary policy, which is shaped by the Federal Reserve (Fed). The Fed has two mandates: to achieve price stability (control inflation) and foster full employment. Its primary tool to achieve these two goals is by adjusting interest rates.
When prices are rising too quickly and inflation is above the Fed’s 2% target, the Fed will raise rates, which helps the USD value. When inflation falls below 2% or the Unemployment Rate is too high, the Fed may lower interest rates, which weighs on the Greenback.
In extreme situations, the Federal Reserve can also print more Dollars and enact quantitative easing (QE). QE is the process by which the Fed substantially increases the flow of credit in a stuck financial system.
It is a non-standard policy measure used when credit has dried up because banks will not lend to each other (out of the fear of counterparty default). It is a last resort when simply lowering interest rates is unlikely to achieve the necessary result. It was the Fed’s weapon of choice to combat the credit crunch that occurred during the Great Financial Crisis in 2008. It involves the Fed printing more Dollars and using them to buy US government bonds predominantly from financial institutions. QE usually leads to a weaker US Dollar.
Quantitative tightening (QT) is the reverse process whereby the Federal Reserve stops buying bonds from financial institutions and does not reinvest the principal from the bonds it holds maturing in new purchases. It is usually positive for the US Dollar.

Temptations Creamy Puree Cat Treats, Chicken, Salmon & Tuna, 24 Count | Under 15 calories per tube, great for senior cats, no chewing required, no added sugar, fillers, or artificial preservatives
$11.49 (as of July 25, 2026 02:48 GMT +00:00 - More infoProduct prices and availability are accurate as of the date/time indicated and are subject to change. Any price and availability information displayed on [relevant Amazon Site(s), as applicable] at the time of purchase will apply to the purchase of this product.)
Apple 2026 MacBook Air 13-inch Laptop with M5 chip: Built for AI, 13.6-inch Liquid Retina Display, 16GB Unified Memory, 512GB SSD, 12MP Center Stage Camera, Touch ID, Wi-Fi 7; Midnight
$1,259.99 (as of July 25, 2026 03:02 GMT +00:00 - More infoProduct prices and availability are accurate as of the date/time indicated and are subject to change. Any price and availability information displayed on [relevant Amazon Site(s), as applicable] at the time of purchase will apply to the purchase of this product.)
Wowflash 100 Count Dog Belly Bands for Male Dogs, Male Dog Diapers Disposable, Leakproof Dog Wraps with Wetness Indicator, Breathable Quick-Dry, Secure Fit for Doggy Puppy Training, Small
$32.99 (as of July 25, 2026 02:53 GMT +00:00 - More infoProduct prices and availability are accurate as of the date/time indicated and are subject to change. Any price and availability information displayed on [relevant Amazon Site(s), as applicable] at the time of purchase will apply to the purchase of this product.)
Ring Battery Doorbell (newest model), Retinal 2K with wide-angle video, up to 6x Enhanced Zoom, Two-Way Talk, and Built-In Battery, 2-pack Speckled Gray
$89.99 (as of July 25, 2026 03:02 GMT +00:00 - More infoProduct prices and availability are accurate as of the date/time indicated and are subject to change. Any price and availability information displayed on [relevant Amazon Site(s), as applicable] at the time of purchase will apply to the purchase of this product.)


Post Comment