20-Year Yield Rockets Past 5%—Are We on the Brink of a Financial Storm or a Hidden Opportunity?
The 20-year US Treasury Yield has just cracked the 5% mark — a threshold that instantly gets economists, investors, and market watchers buzzing. But honestly, what does it really mean when a long-duration fixed income yield hits that level? Most people shy away from these lengthy bonds, wary of the opportunity cost, especially with inflation lurking in the background. When yields rise, it’s a sign that demand for these government securities is slipping, which often hints that investors are chasing greener pastures—like equities. So, could this yield milestone actually be a subtle whisper about higher future stock returns? Or is it just another financial red herring in a market full of noise? Historically, moments when the 20-year yield has breached this level have coincided with some pretty turbulent chapters: from the post-war booms to the dot-com frenzy, even the recent post-COVID tightening. Intriguingly, the relationship between these yield surges and equity performance isn’t always straightforward—sometimes periods tagged as “booms” deliver modest returns, while “struggle” periods surprise with resilience. So how should savvy investors decode this signal and adjust their sails accordingly? Dive in as we unpack decades of data, trends, and insights that challenge conventional wisdom and might just recalibrate your investment compass. LEARN MORE
img#mv-trellis-img-1::before{padding-top:51.5625%; }img#mv-trellis-img-1{display:block;}img#mv-trellis-img-2::before{padding-top:50.390625%; }img#mv-trellis-img-2{display:block;}img#mv-trellis-img-3::before{padding-top:50.1953125%; }img#mv-trellis-img-3{display:block;}img#mv-trellis-img-4::before{padding-top:24.043715846995%; }img#mv-trellis-img-4{display:block;}
The 20-year US Treasury Yield breaches 5% recently.
What does that mean?
I think not a lot of people buy such a long duration fixed income yield because you are taking on a lot of opportunity cost risk, such as potentially losing out to high inflation. If yields go up, it kind of means demand is lower relatively speaking.
Demand usually should be read together with other competing assets and the main one are equities. If demand is lower usually kind of means its because demand for equities is higher.
So long term yields moving high usually signals future equity returns should be higher. This is especially for such a long maturity government fixed income.
But if yields are too high or too low, usually it indicates some sort of systematic unbalance such that this signal is kind of faulty. Long story short useful if it is not too extreme.
But in a way, folks always say long term breaches 5% nothing good happens. I am not sure what is the time frame they are considering this as.
I can understand that because borrowing costs stay high. Imagine how your REITs would feel.
But in a way, my mental model has always been, cost of borrowing is just one part and what is more important is whether you can expand your revenue or not.
So it puts pressure but it doesn’t always cause problems.
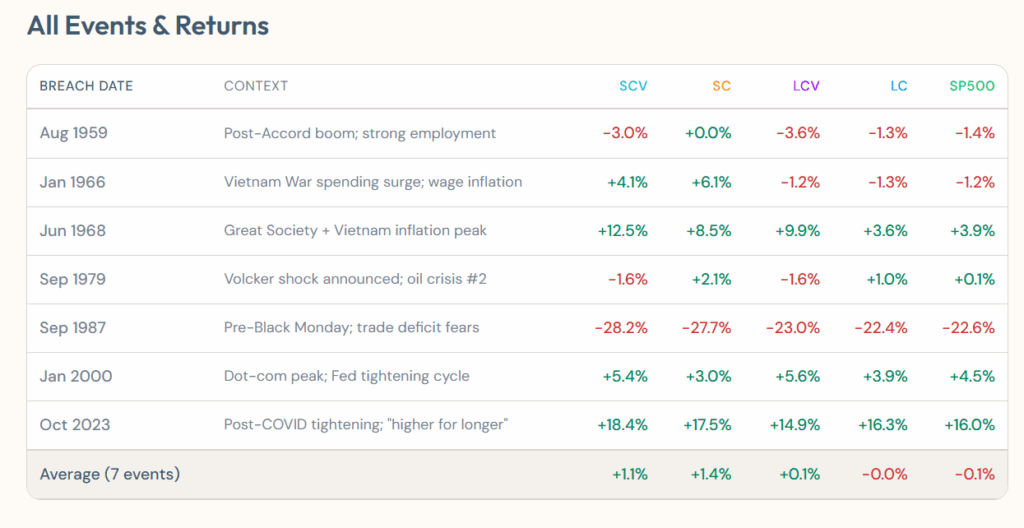
Since we have US Treasury yield data going back to 1962, we can pick out the time when the 20-year US yield breaches 5% from below.
This means the yield is lower but now higher.
You can review the full Interactive HTML here >>
The LLM picks out about 7 of these instances:
- Aug 1959: Post-Accord boom; strong employment
- Jan 1966: Vietnam War spending surge; wage inflation
- Jun 1968: Great Society + Vietnam inflation peak
- Sep 1979: Volcker shock announced; oil crisis #2
- Sep 1987: Pre-Black Monday; trade deficit fears
- Jan 2000: Dot-com peak; Fed tightening cycle
- Oct 2023: Post-COVID tightening; “higher for longer”
I am always interested in a few US equity data:
- US Small Cap (SC)
- US Small Cap Value (SCV)
- US Large Cap (LC and SP500)
- US Large Cap Value (LCV)
So I have these Dimensional data together with S&P 500 and we can see what happens a few months after this:
3 Months after the 5% Breach

First thing is… it is not always coherent. I do tend to think there are more green than red.
Some would say the time period today is different, but I do think some of these are also not so easy to deal with in the past.
6 Months after the 5% Breach

6 months we see there aren’t that big of a difference between small cap , large cap, blend or value. It is not always that investing in small caps mean a more significant drawdown.
More so, I think other stuff influences the returns than just prices.
12 Months after the 5% Breach

12 months in we can see it is still a mixture of red and green.
What I find interesting is that those periods that were labelled as boom, great society, their 12 month returns are the most muted.
Whereas those who are labelled more as struggles actually end up performing better.
In a way, we might always have to think the opposite:
- If it is good now, what comes later may be a struggle.
- If it is poor now, what comes later may be better.
If so how do we deploy our money? Not the most intuitive but sometimes we got to train ourselves.

Do Like Me on Facebook. I share some tidbits that are not on the blog post there often. You can also choose to subscribe to my content via the email below.
If you’re thinking of opening an Interactive Brokers account, my referral link is here.
As the new account holder, you’ll receive USD 1 in IBKR stock for every USD 100 you deposit, up to USD 1,000 in shares — so a USD 10,000 deposit gets you USD 100 in IBKR stock, and the bonus is capped at USD 1,000 for deposits of USD 100,000 or more. A few other things to know: the minimum deposit to qualify is USD 10,000, done within 30 days of opening, and the bonus shares are locked up for one year from the award date. The promotion is currently active, and using the link costs you nothing extra. On a separate note, if you haven’t already, it’s worth taking a look at how IBKR’s share price has performed over the past five years — the stock you receive as a bonus isn’t just a token; it’s a stake in a company that has done quite well for its shareholders.
I break down my resources according to these topics:
- All my personal notes about how my philosophy behind my own money and how I manage it.
- Building Your Wealth Foundation – If you know and apply these simple financial concepts, your long term wealth should be pretty well managed. Find out what they are
- Active Investing – For active stock investors. My deeper thoughts from my stock investing experience
- Learning about REITs – My Free “Course” on REIT Investing for Beginners and Seasoned Investors
- Dividend Stock Tracker – Track all the common 4-10% yielding dividend stocks in SG
- Free Stock Portfolio Tracking Google Sheets that many love
- Retirement Planning, Financial Independence and Spending down money – My deep dive into how much you need to achieve these, and the different ways you can be financially free
- Providend – Where I work and do research. Fee-Only Advisory. No Commissions. Financial Independence Advisers and Retirement Specialists. No charge for the first meeting to understand how it works
Kyith is the Owner and Sole Writer behind Investment Moats. Readers tune in to Investment Moats to learn and build stronger, firmer wealth foundations, how to have a Passive investment strategy, know more about investing in REITs and the nuts and bolts of Active Investing.
Readers also follow Kyith to learn how to plan well for Financial Security and Financial Independence.
Kyith worked as an IT operations engineer from 2004 to 2019. Currently, he works as a Senior Solutions Specialist in Fee-only Wealth Advisory Firm Providend. All opinions on Investment Moats are his own and does not represent the views of Providend.
You can view Kyith’s current portfolio here, which uses his Free Google Stock Portfolio Tracker.
His investment broker of choice is Interactive Brokers, which allows him to invest in securities from different exchanges all over the world, at very low commission rates, without custodian fees, near spot currency rates.
You can read more about Kyith here.

UP URARA PUP Pink Plaid Bowtie Dog Collar - Summer Comfortable Cotton Collar With Metal Buckle for Puppy Boy Girl, M
$16.99 (as of July 8, 2026 02:49 GMT +00:00 - More infoProduct prices and availability are accurate as of the date/time indicated and are subject to change. Any price and availability information displayed on [relevant Amazon Site(s), as applicable] at the time of purchase will apply to the purchase of this product.)
Apple AirPods 4 Wireless Earbuds, Bluetooth Headphones, Personalized Spatial Audio, Sweat and Water Resistant, USB-C Charging Case, H2 Chip, Up to 30 Hours of Battery Life, Effortless Setup for iPhone
(as of July 8, 2026 02:53 GMT +00:00 - More infoProduct prices and availability are accurate as of the date/time indicated and are subject to change. Any price and availability information displayed on [relevant Amazon Site(s), as applicable] at the time of purchase will apply to the purchase of this product.)
Voice-Magic-for-LG-TV-Remote-Control-Replacement Compatible with LG Smart OLED Thinq Webos TVs for AKB75855501 AN-MR24gn MR23gn MR22gn MR21ga MR20ga
$19.98 (as of July 8, 2026 02:59 GMT +00:00 - More infoProduct prices and availability are accurate as of the date/time indicated and are subject to change. Any price and availability information displayed on [relevant Amazon Site(s), as applicable] at the time of purchase will apply to the purchase of this product.)
Purina Tidy Cats Lightweight Cat Litter, Clumping Multi Cat, Glade Clear Springs Odor Control, Low Dust, 38 lb. Box
$25.99 (as of July 8, 2026 02:48 GMT +00:00 - More infoProduct prices and availability are accurate as of the date/time indicated and are subject to change. Any price and availability information displayed on [relevant Amazon Site(s), as applicable] at the time of purchase will apply to the purchase of this product.)


Post Comment