Brace Yourself: US Inflation Inches Toward a Three-Year High—What This Means for Your Wallet and Investments Now
Brace yourselves—Tuesday’s about to drop a bombshell in the world of inflation stats. The US Bureau of Labor Statistics is set to roll out April’s Consumer Price Index, and the buzz? Another hefty jump in consumer inflation, hot on the heels of March’s steep climb. What’s fueling this fire? Sky-high oil prices, courtesy of the ongoing US-Iran conflict. Talk about global affairs shaking up your grocery bill! Experts are forecasting a 0.6% monthly rise in CPI—down slightly from March’s 0.9% surge but still enough to keep wallets tight and heads spinning. Even core CPI, the so-called “clean” number stripping out food and energy, looks sticky at 0.4%, suggesting inflation’s grasp isn’t loosening anytime soon. Since the Middle East tensions escalated, West Texas Intermediate crude has ballooned past the 50% mark—though it’s cooled a smidge—yet prices remain way above pre-conflict levels. So, what’s the real story behind these numbers, and how might they shake up everything from Federal Reserve moves to the EUR/USD currency duel? Ready to dive deep and decode the implications for your investments and the broader economy? Let’s unpack the turbulence ahead. LEARN MORE
The US Bureau of Labor Statistics (BLS) will publish the April Consumer Price Index (CPI) data on Tuesday. The report is expected to show another significant leap in consumer inflation after March’s sharp increase, driven by the elevated Oil prices due to the ongoing conflict between the United States (US) and Iran.
The monthly CPI is forecast to rise 0.6%, following the 0.9% increase recorded in March, while the annual reading is seen climbing to its highest level since September 2023 at 3.7%, from 3.3% in March. Core CPI figures, which exclude volatile food and energy prices, are expected to come in at 0.4% and 2.7%, on a monthly and yearly basis, respectively.
From the beginning of the conflict in the Middle East on February 28 to the end of April, the barrel of West Texas Intermediate (WTI) rose more than 50%. Although crude Oil prices corrected lower in the first week of May, they are still about 40% above where they were before the US-Iran war.
Previewing the inflation data, “our economists expect headline inflation to rise by +0.58% month-on-month, moderating from March’s +0.9%, but still relatively firm,” said Deutsche Bank’s Jim Reid.
“In contrast, the core measure is projected to accelerate to +0.39% MoM from +0.2%, suggesting underlying price pressures remain sticky even as energy-related effects fade. The YoY rates would move from 3.3% to 3.8% for the former and from 2.6% to 2.8% for the latter,” Reid added.
Economic Indicator
Consumer Price Index (YoY)
Inflationary or deflationary tendencies are measured by periodically summing the prices of a basket of representative goods and services and presenting the data as The Consumer Price Index (CPI). CPI data is compiled on a monthly basis and released by the US Department of Labor Statistics. The YoY reading compares the prices of goods in the reference month to the same month a year earlier.The CPI is a key indicator to measure inflation and changes in purchasing trends. Generally speaking, a high reading is seen as bullish for the US Dollar (USD), while a low reading is seen as bearish.
What to expect in the next CPI data report?
CPI figures for April will reflect the impact of persistently high Oil prices on inflation. Since this is largely anticipated, core inflation figures will help markets gauge whether rising energy costs are spilling over into the broader economy and driving up the prices of other goods and services.
A reading above the market expectation of 0.4% in the monthly core CPI could feed into concerns over high inflation getting entrenched in the economy. Conversely, a print below analysts’ forecast could ease fears over prices getting out of control. Still, even in this latter scenario, investors are unlikely to breathe a sigh of relief because the US-Iran crisis remains unresolved and the lack of naval activity in the Strait of Hormuz continues to pose a significant risk to global energy supply chains.
Minneapolis Federal Reserve (Fed) President Neel Kashkari said the price shock from a prolonged closure of the strait could put inflation expectations at risk and requires a strong policy response. Similarly, St. Louis Fed President Alberto Musalem noted that inflation is meaningfully above the Fed’s target and added that policymakers need to worry about the underlying inflation, along with tariff and Oil shocks.
How could the US Consumer Price Index report affect EUR/USD?
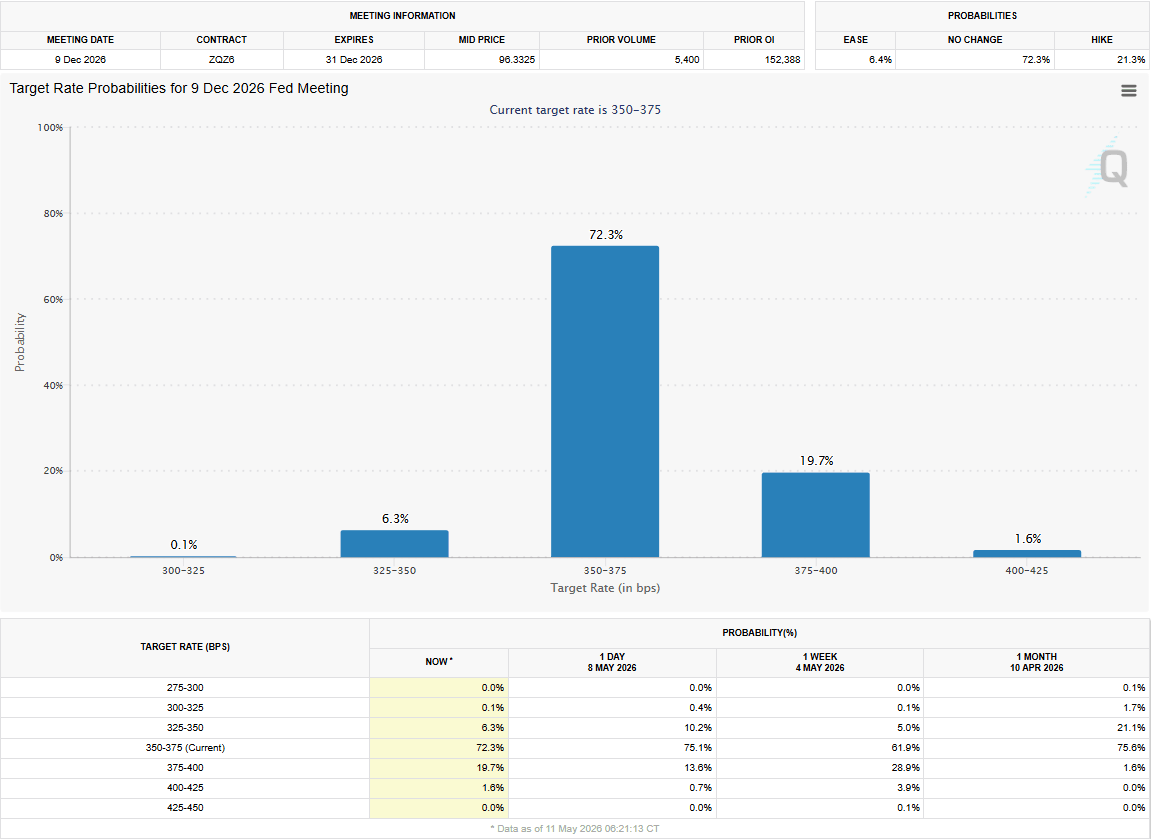
Markets currently see about a 73% chance of the Fed leaving the policy rate unchanged at 3.5%-3.75% by the end of the year, and price in about a 20% probability of a 25 basis points (bps) hike, according to the CME FedWatch Tool.

A stronger-than-forecast monthly core CPI print for April could cause investors to lean toward a rate hike later in the year. In this scenario, the US Dollar (USD) could gather strength with the immediate reaction.
On the other hand, a soft core CPI print could have the opposite effect on the USD’s valuation. However, unless there are any significant developments hinting at the US-Iran conflict coming to an end soon, any negative impact on the USD could remain short-lived.
“Investors will be on heightened alert for the possibility of further delays to the first rate cut – or even an inability to ease in 2H26 altogether – should energy prices rise sharply and persistently due to an escalation or prolongation of the Middle East conflict,” UOB Group’s Alvin Liew explains.
“A broader oil-related price spillover across the CPI basket would materially complicate the inflation outlook, raising the risk that the anticipated year-end cut is pushed into 2027,” Liew elaborates.
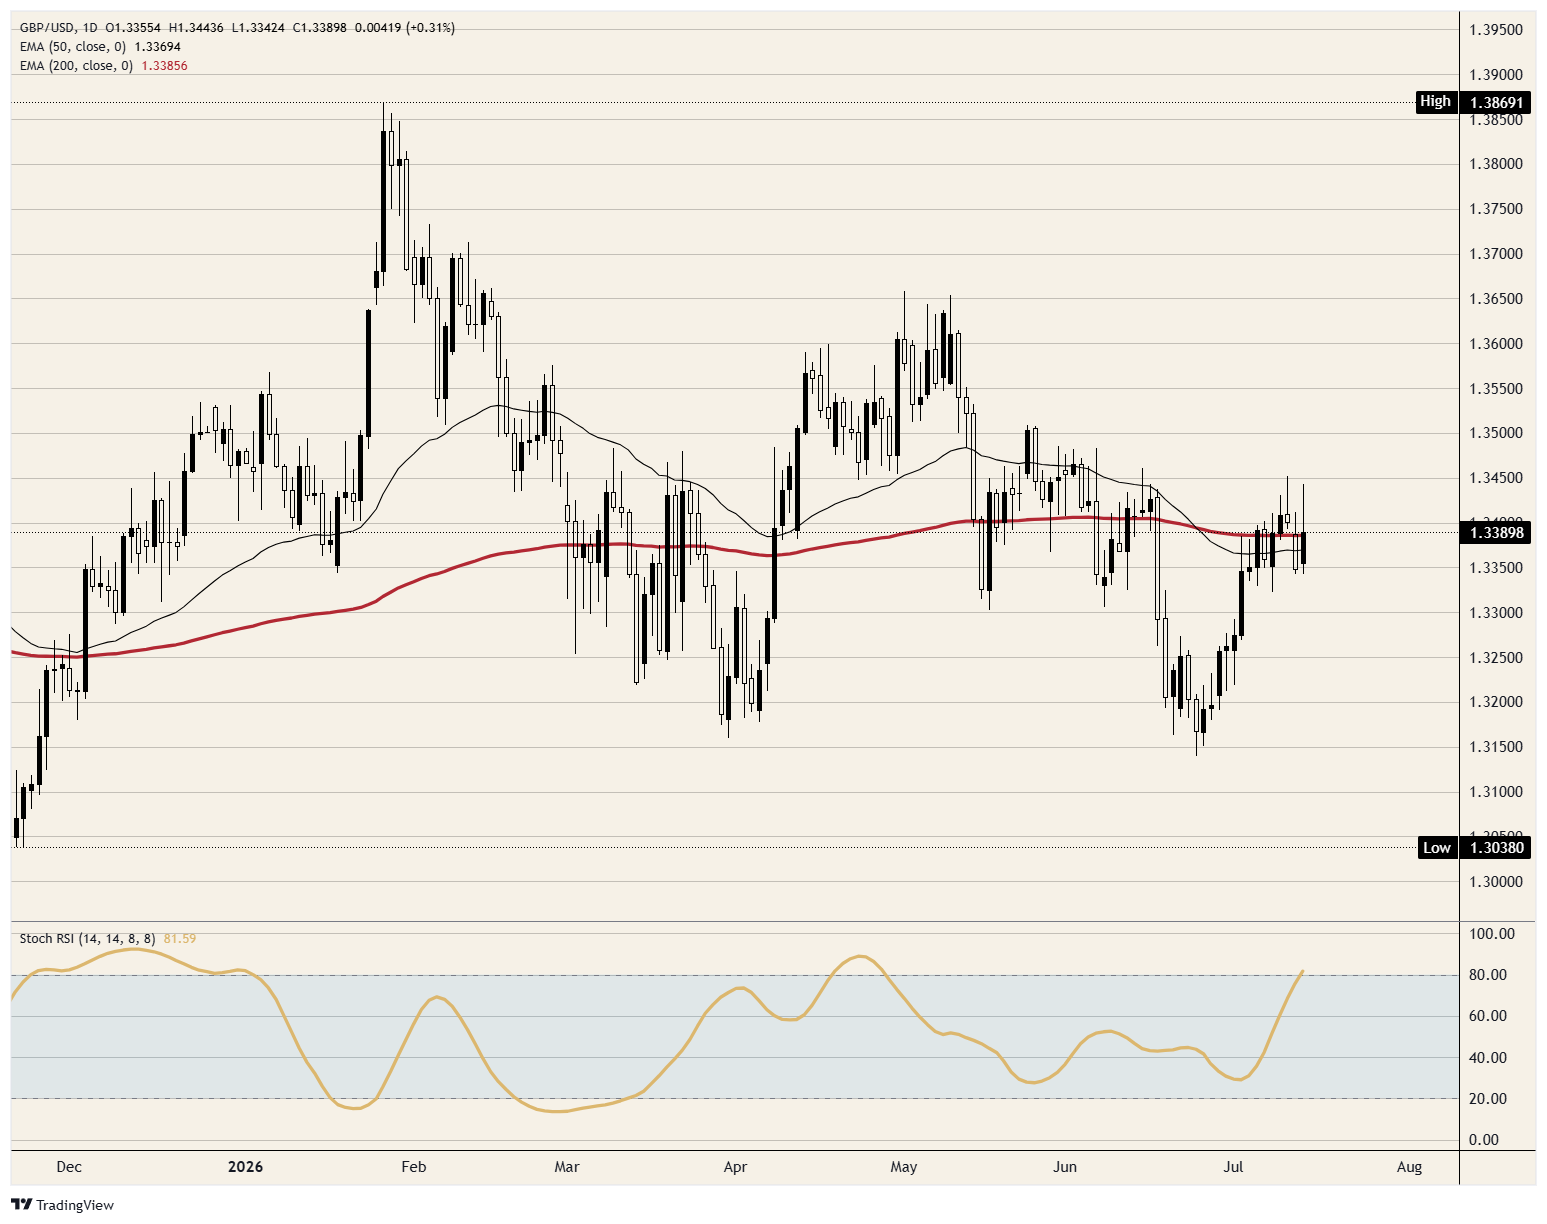
Eren Sengezer, FXStreet European Session Lead Analyst, shares a brief technical outlook for EUR/USD.
“EUR/USD’s near-term technical outlook points to a bullish stance that lacks strength. The Relative Strength Index (RSI) indicator on the daily chart holds above 50 but retreats after testing 60, and the pair struggles to pull away from the 20-day Simple Moving Average (SMA) despite closing well above it to end the previous week.”
“On the upside, the first resistance area aligns at 1.1800-1.1820, where the upper limit of the Bollinger Band and the Fibonacci 61.8% retracement of the February-April downtrend align. In case EUR/USD manages to stabilize above this region, 1.1900-1.1910 (round level, Fibonacci 78.6% retracement) could be seen as the next hurdle ahead of 1.2000 (psychological level).”
Looking south, a strong support area seems to have formed at 1.1730-1.1680 (Fibonacci 50% retracement, 100-day SMA, 200-day SMA). If EUR/USD drops below the lower limit of this range and starts using it as resistance, technical sellers could take action. In this case, 1.1660 (ascending trend line) could be seen as an interim support level before 1.1560 (Fibonacci 23.6% retracement).”

Fed FAQs
Monetary policy in the US is shaped by the Federal Reserve (Fed). The Fed has two mandates: to achieve price stability and foster full employment. Its primary tool to achieve these goals is by adjusting interest rates.
When prices are rising too quickly and inflation is above the Fed’s 2% target, it raises interest rates, increasing borrowing costs throughout the economy. This results in a stronger US Dollar (USD) as it makes the US a more attractive place for international investors to park their money.
When inflation falls below 2% or the Unemployment Rate is too high, the Fed may lower interest rates to encourage borrowing, which weighs on the Greenback.
The Federal Reserve (Fed) holds eight policy meetings a year, where the Federal Open Market Committee (FOMC) assesses economic conditions and makes monetary policy decisions.
The FOMC is attended by twelve Fed officials – the seven members of the Board of Governors, the president of the Federal Reserve Bank of New York, and four of the remaining eleven regional Reserve Bank presidents, who serve one-year terms on a rotating basis.
In extreme situations, the Federal Reserve may resort to a policy named Quantitative Easing (QE). QE is the process by which the Fed substantially increases the flow of credit in a stuck financial system.
It is a non-standard policy measure used during crises or when inflation is extremely low. It was the Fed’s weapon of choice during the Great Financial Crisis in 2008. It involves the Fed printing more Dollars and using them to buy high grade bonds from financial institutions. QE usually weakens the US Dollar.
Quantitative tightening (QT) is the reverse process of QE, whereby the Federal Reserve stops buying bonds from financial institutions and does not reinvest the principal from the bonds it holds maturing, to purchase new bonds. It is usually positive for the value of the US Dollar.

Monster Rehab Tea + Lemonade + Energy, Energy Drink 15.5 Ounce | Energy Iced Tea, Pack of 15
(as of July 14, 2026 02:45 GMT +00:00 - More infoProduct prices and availability are accurate as of the date/time indicated and are subject to change. Any price and availability information displayed on [relevant Amazon Site(s), as applicable] at the time of purchase will apply to the purchase of this product.)
Amazon Basics Dog Poop Leak Proof Bags with Dispenser and Leash Clip, Unscented, 13" x 9" Large Size, 300 Count
(as of July 15, 2026 02:41 GMT +00:00 - More infoProduct prices and availability are accurate as of the date/time indicated and are subject to change. Any price and availability information displayed on [relevant Amazon Site(s), as applicable] at the time of purchase will apply to the purchase of this product.)
YGKSAA 2pcs USB C to 3.5mm Female Headphone Jack Adapter, Upgrade Metal Case, Compatible with Samsung S20+/S21 Ultra, iPhone15 16 17, and More USB C Audio Devices
(as of July 14, 2026 03:00 GMT +00:00 - More infoProduct prices and availability are accurate as of the date/time indicated and are subject to change. Any price and availability information displayed on [relevant Amazon Site(s), as applicable] at the time of purchase will apply to the purchase of this product.)
CuteBone Little Miss Sassy Pants Dog Leopard Print Dress Velvet for Small Dogs Girl Puppy Dresses Pink Dog Clothes
(as of July 14, 2026 02:51 GMT +00:00 - More infoProduct prices and availability are accurate as of the date/time indicated and are subject to change. Any price and availability information displayed on [relevant Amazon Site(s), as applicable] at the time of purchase will apply to the purchase of this product.)


Post Comment